High-purity water systems often go unnoticed — until they fail. When they do, they disrupt analyser uptime, delay results, and increase stress for lab staff.
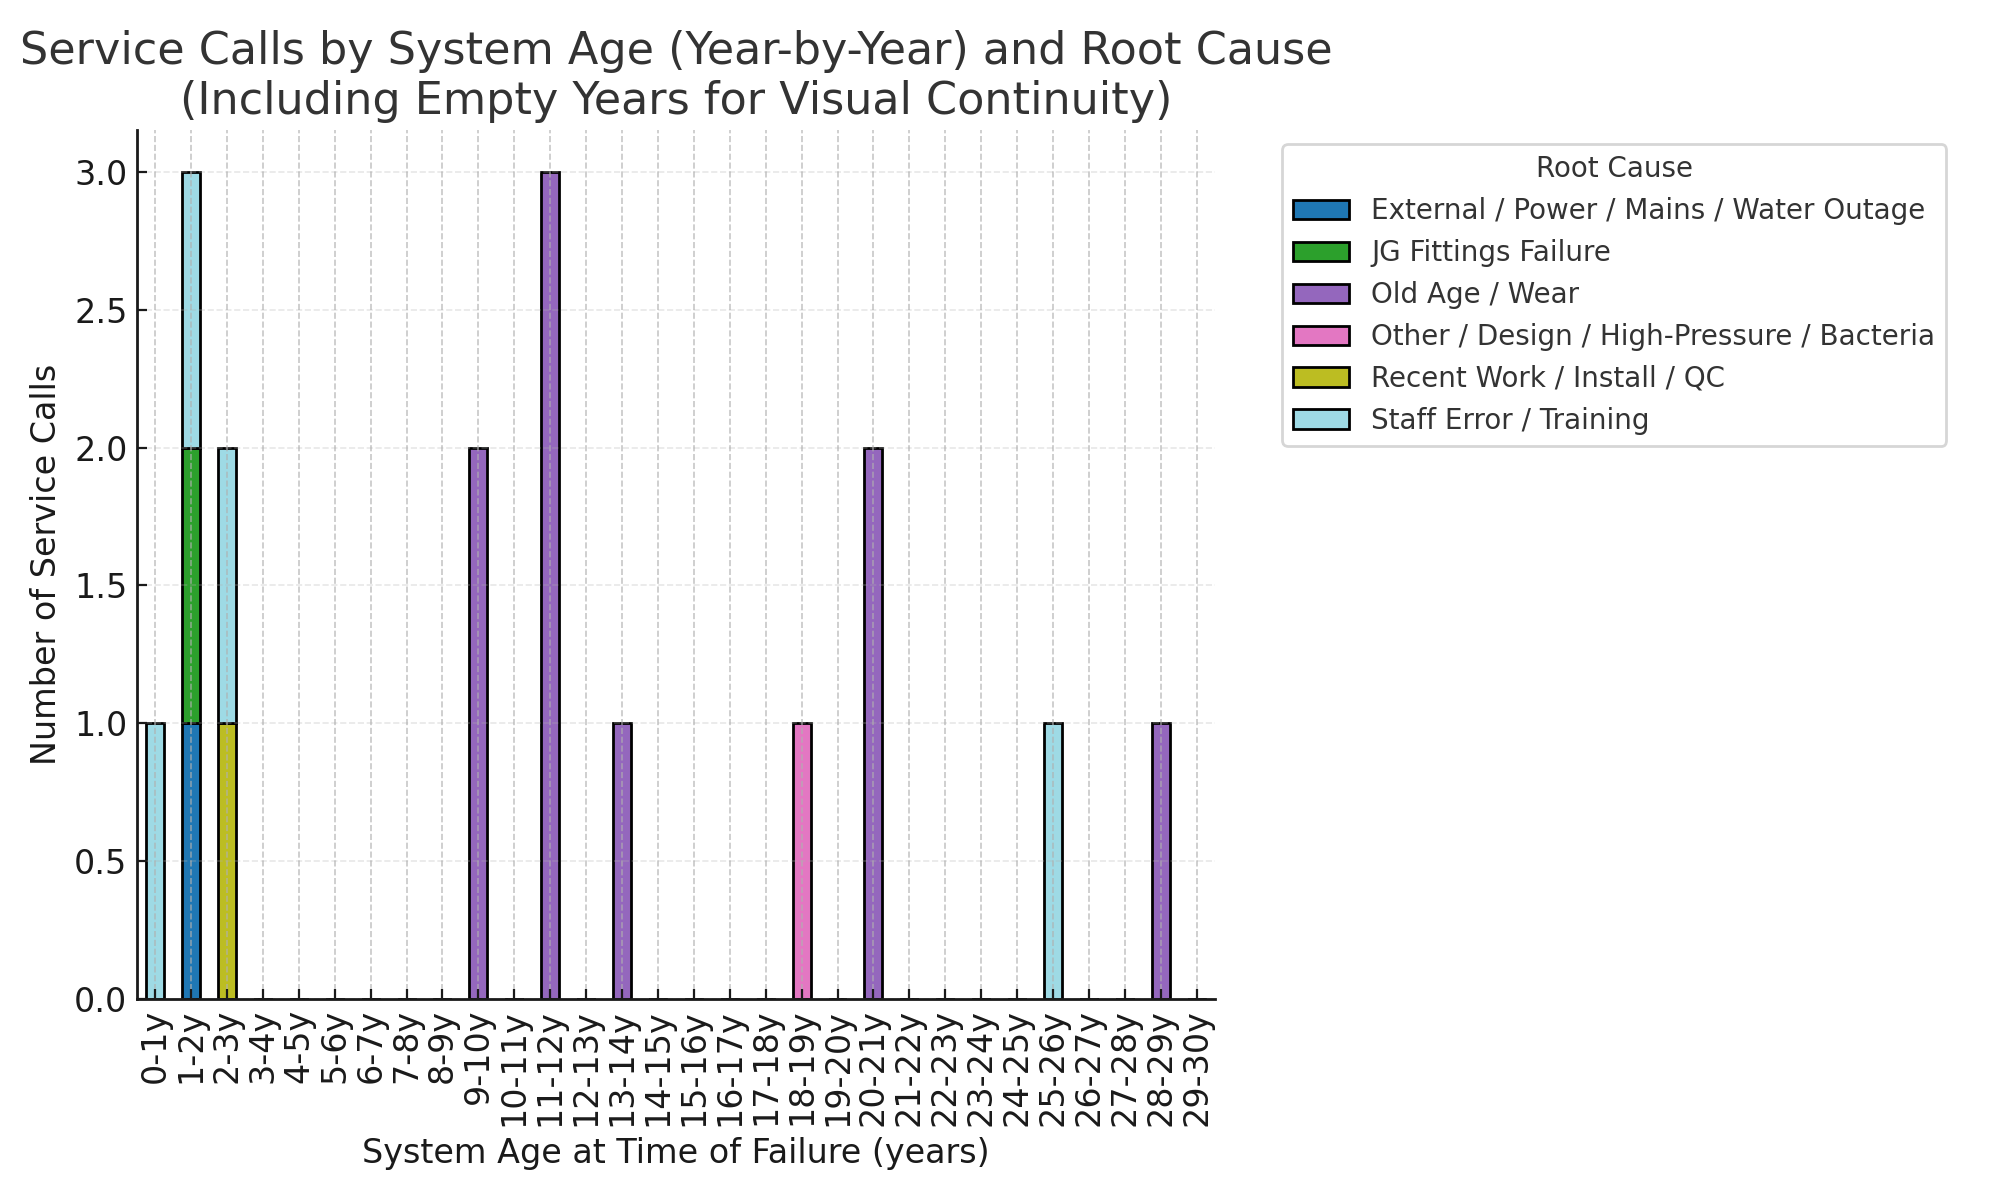
To understand how reliability changes over time, we analysedour call logs calls and mapped them against the age of the machines. The year-by-year chart shows a clear pattern.
What the Data Shows
Early Years (0–3) Most calls were not hardware failures but:
Staff mistakes during filter changes or leaving the RO unit off.
Minor install or QC oversights.
External factors such as power outages or low mains pressure in the building.
These can largely be prevented with better install checklists and simple staff guidance.
Middle Years (4–7) Units in this range are generally stable and low-cost provided they receive routine preventive maintenance.
Wear-Out Years (7–10) Calls begin to rise as components age:
Pump heads and seals.
Probe assemblies.
Float switches and O-rings.
Proactive part swaps from year 7 can prevent many emergency visits.
Reliability Spike (10–12) This is the peak for service calls, dominated by age-related failures of pumps, probes, fittings and filter heads.
For high-throughput labs, planned refurbishment or replacement is often more cost-effective than repeated urgent repairs.
Long-Life Tail (15 + Years) Legacy units still running often need multiple interventions per year and carry higher downtime risks.
A retirement or rebuild plan for units over 15 years old is essential.
Root-Cause Patterns
Wear-out failures dominate after year 7.
Staff errors and install issues cluster early in life.
External mains and power issues appear at random across all ages.
Practical Actions
Start enhanced checks and part swaps at year 7.
Keep common wear items in stock to cut downtime.
Provide a simple quick-reference card or short videos to reduce early-life errors.
Use age-band data to plan refurbishment or replacement cycles.
The Take-Home Message
Early-life issues are mostly preventable with good installation and training. True wear-out starts around year 7 and peaks at 10–12 years. By acting early and planning ahead, labs can avoid most urgent failures, lower lifetime costs, and keep analysers running when they’re needed most.
How much does a lab water system cost to maintain?
If you manage a laboratory, you want the full picture: what drives price, how to avoid hidden costs, and how to choose a system that won’t let you down test. This guide lays out the true cost of ownership, fit by application, and the pros/cons of each system type.
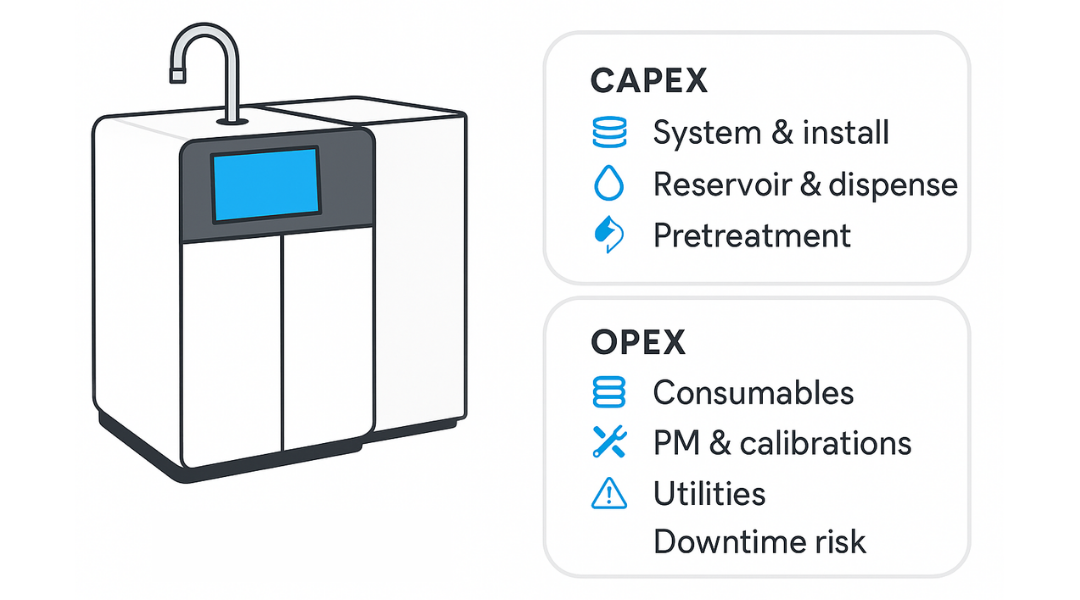
The quick overview (what you’re really paying for)
Up-front (CAPEX)
System hardware (Type III RO / Type II polish / Type I ultrapure, or a combined bench-top)
Downtime (the hidden one: delayed assays, staff time, off-site water purchases)
PurificLab Water System Price Range
The below table is a range indicator of what a Purific system might cost to run over a 10-year period. Obviously, consumables cost is not included due to there being two main factors that are outside of our control.
Feed water quality.
Pure water usage.
Note: When estimating your consumable usage analyser companies will always give you maximum usage which in our experience can be anywhere up to 50% more than actual average usage. The best method to verify consumption is to measure actually usage over a 2 week period.
Optional Complete Cover – Zero Call-out Fees (Annual)
$1,150
$1,250
$2,250
Consumables (Cost per Liter)
$0.03
$0.03
$0.03
Capital Outlay
$8,500 – $16,000
$15,000 – $31,500
$25,000 – $41,500
10 Year Maintenance Cost Projection
$11,000 – $30,500
$25,000 – $50,000
$32,500 – $67,000
Total Lifespan Cost Range (10 Years) ex. consumables
$19,500 – $46,500
$40,000 – $77,000
$57,500 – $108,500
Which “type” water do you actually need?
It is important to be aware there are more than 1 standard that can be applied when looking at laboratory grade water. Read https://purific.com/waterstandards/ to understand more about this topic. These include ASTM, ISO 3696:1987, and CLSI (formerly NCCLS).
Generally the following grades would be applicable but is it important to ensure that the quality water your laboratory specifies is fit for purpose.
Type III (RO): Glassware rinse, autoclaves, feed to Type II/I.
Type II (pure): General reagents, buffers, instruments not sensitive to organics.
Type I (ultrapure): HPLC/LC-MS, molecular biology, cell culture, trace analysis; often with TOC monitoring, optional UF (endotoxin, RNase/DNase control), and final 0.22 µm.
Many labs run a stack (Type III → II → I) or a compact benchtop that takes RO/tap and outputs Type I on demand.
Factors to consider when trying to estimate what your lab water system will cost.
What really drives the price (and reliability)?
Daily volume & peak draw (L/day, L/min) and whether you need a reservoir.
Service & Support Is 24/7 Technical support a requirement i.e. does your laboratory support a hospital emergency department? What happens if you system breaks down during the night?
Feed water quality (hardness, silica, chlorine/chloramine, organics/TOC) → pretreatment spec.
Consumables cadence (change intervals at your usage).
Pros & cons by system approach
Ultrapure bench-top (Type II & I)
Pros: Small footprint, point-of-use purity, quick-change consumables, ideal for sensitive assays.
Cons: Needs suitable feed (RO), reservoir planning matters for peak flows if feed supply has limited capacity.
Wall Mounted (Type II/SRW)
Pros: No lost bench space, small footprint, point-of-use purity, ideal for mid size laboratories needing larger volumes of water but not type 1 grade, standard tap water is suitable feed quality in most cases, ideal for clinical analyser supply.
Cons: Cannot provide ASTM Type 1 grade water, must have sufficient wall space available in laboratory.
Modular RO + Type II + Type I stack
Pros: Scalable; robust for higher daily volumes, clear staging of consumables,
Cons: More space, more plumbing, plan maintenance windows across modules.
Central system feeding multiple taps
Pros: Best for many users/rooms, uniform quality, fewer individual units to service
Cons: Higher CAPEX, harder to maintain high quality due to the number of instances for contamination. i.e every tap, loop join provides opportunity for contamination, distribution loop design/validations, Point of use polishers still required for quality assurance.
The maintenance picture (how to avoid “death by downtime”)
User-Serviceable Can your system be maintained by the staff to ensure your laboratory is not beholden to the water system supplier i.e. minor issues can be self-diagnosed and repaired by staff or via the help of a phone call.
Design for service: quick-change cartridges, clean handling, and service level provided by vendor.
Plan intervals: establish change triggers by throughput or quality thresholds (resistivity, TOC)
This table outlines the contaminants that must be removed to achieve Type 1 ultrapure water quality (HPLC, LC-MS, ICP-MS, molecular biology, cell culture), including the target parameter, filtration or purification media, method, and the logic for removal.
Is it crucial that you have a reliable supply of pure or ultra-pure water in your laboratory?
During a recently yearly service of the Purific system pictured below, we found that it had been installed in 1998 and has been in operation ever since. That’s 24 years of service and counting.
We are passionate about what we do, and it is exhilarating when we see a Purific still supporting our customers core laboratory after all these years.
Concerned about service and reliability?…We’d love to talk.
*Requires use of 0.2 μm membrane filter; **Prepared by distillation; ***Requires the use of 0.45 μm membrane filter.
Clinical and Laboratory Standards Institute (CLSI) – formerly NCCLS
As of 2006, the CLSI has moved away from the typical Type I, II and III designations, instead preferring to suggest that water be simply ‘fit for purpose’, and only describes one grade in significant detail: Clinical Reagent Laboratory Water. The CLSI has also briefly outlined other grades in less detail, such Special Reagent Water (SRW) and instrument feed water.
Parameter
CLSI-CLRW
Resistivity (MΩ·cm at 25°C)
≥10.0
Conductivity (µS/cm at 25°C)
≤0.1
TOC (ppb)
≤500
Bacteria (CFU/mL)
≤10
Endotoxins (EU/mL)
≤0.25
Silica (mg/L)
≤0.05
Particulates
0.22 µm filtration recommended
pH
Not specified
International Organization for Standardization (ISO)
The ISO based its specification on ISO 3696:1987, and specifies three grades of water: Grade 1, Grade 2 and Grade 3, where Grade 1 is the most pure (see below):