
Imagine your lab running a flawless analytical workflow, supported by laboratory water purification systems matched precisely to your application needs. Every HPLC result clean. Every PCR amplification tight. Every ICP-MS calibration curve tracking exactly where it should.
No mysterious baseline drift. No unexplained inhibition. No results you can’t defend.
But right now, that’s not what’s happening, is it? You made a procurement decision at installation and moved on. And now you’re living with whatever that system produces, whether it actually matches your application needs or not.
Here’s the problem with that approach:
- Over-specifying wastes thousands in consumable costs with zero analytical return
- Under-specifying introduces contamination that degrades results silently
- Neither failure announces itself until it’s already in your data
In this guide, I’m going to show you exactly how to match your water purification system to your actual analytical needs, so you stop paying for errors you can’t see and can’t trace.
- 3x standards bodies define purity grades and they don’t agree
- No single technology produces Type I water alone
- Grade is set by your most sensitive analytical endpoint
- Resistivity alone misses TOC, biofilm, and endotoxins
- Total cost of ownership beats purchase price every time
The 3x Standards That Define Water Purity
Most labs pick a water grade and treat it like a settled question. They shouldn’t.
Before you evaluate any purification system, you need a fixed reference for what each grade actually specifies. And here’s where it gets complicated: 3x standards bodies define the grades most labs work against, and they don’t all agree on the thresholds that matter most for your results.
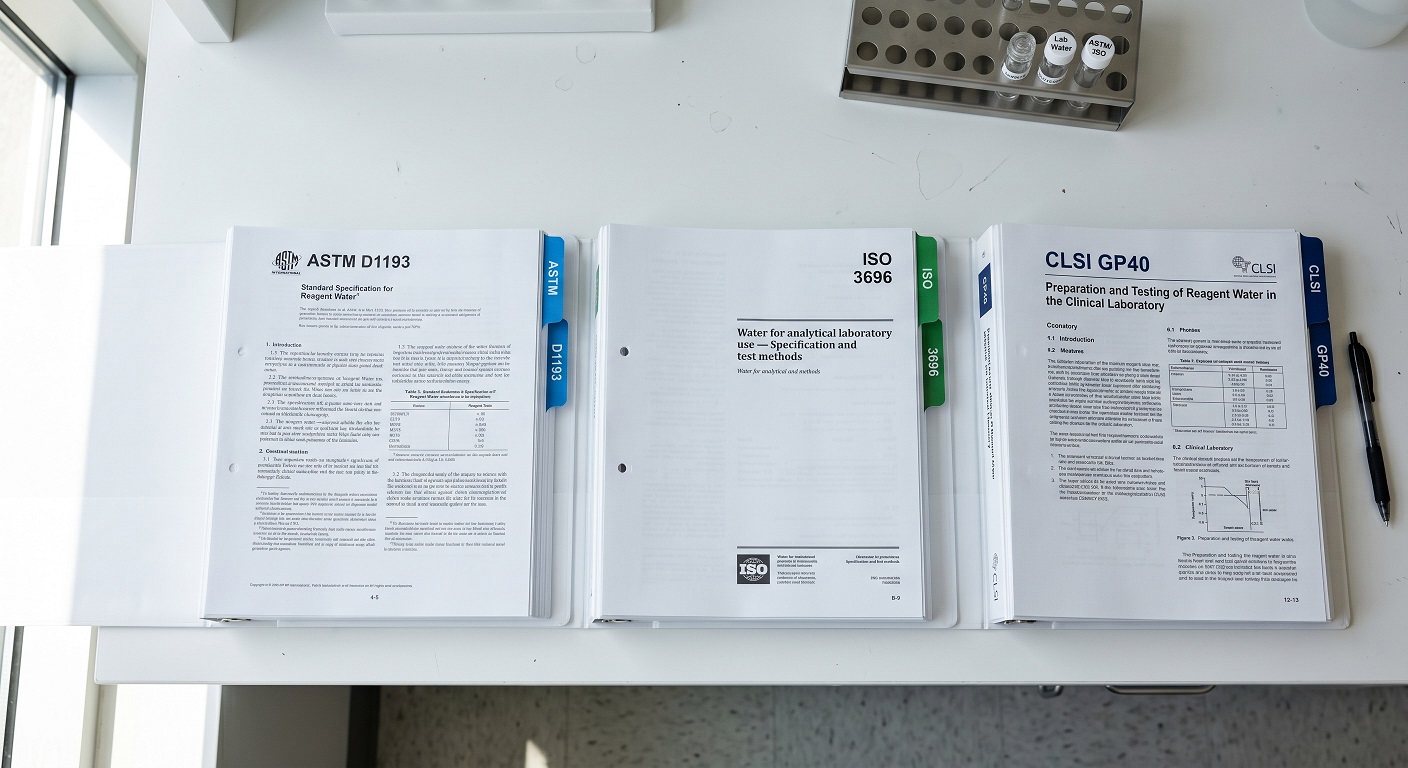
What ASTM D1193 Actually Requires From Your Water
ASTM D1193 is the dominant North American standard. It defines 4x water types.
Type I sets the highest ionic bar: resistivity of at least 18.2 MΩ·cm at 25°C, with total organic carbon (TOC) below 50 ppb. That resistivity must be measured inline, not from a collected sample. Type II drops to 1 MΩ·cm minimum. Type III drops further to 0.05 MΩ·cm, which covers autoclave feed and glassware rinsing.
And here’s something most labs don’t know: the 2024 revision of ASTM D1193 decoupled water type from production method entirely. Any technology stack meeting the numeric output spec is now compliant, regardless of how it gets there.
Where ISO 3696 Differs From ASTM
ISO 3696 runs 3x grades and is more common in European regulatory contexts. Grade 1 is functionally similar to ASTM Type I, but the conductivity ceiling is different. ISO Grade 1 allows up to 0.1 µS/cm. ASTM Type I requires 0.056 µS/cm or below.
That gap matters more than most people realise.
A system certified to ISO Grade 1 is NOT necessarily producing ASTM Type I water. If your instrument standard references ISO Grade 1 for an application that actually needs ASTM Type I purity, you have a problem you may not be able to see in your results.
What CLSI GP40 Defines For Clinical Labs
CLSI GP40 (fifth edition) defines Clinical Laboratory Reagent Water (CLRW) as the benchmark for clinical lab work. CLRW sets resistivity at 10 MΩ·cm minimum, TOC below 500 ppb, bacterial count below 10 CFU/mL, and particles filtered to 0.22 µm. CAP-accredited labs are required to follow CLSI GP40.
But here’s what catches labs out every time:
What Each Grade Permits In Practice
The table below maps each grade to its core numeric specs and the applications it actually covers. The bacterial count and filtration thresholds in the CLRW row reflect CLSI GP40 parameters not specified by ASTM or ISO.
| Grade | Resistivity (MΩ·cm at 25°C) | TOC (ppb) | Representative Applications |
|---|---|---|---|
| ASTM Type I | ≥18.2 | <50 | HPLC, LC-MS, ICP-MS, PCR, cell culture |
| ASTM Type II | ≥1 | <50 | Buffer preparation, media formulation, general chemistry |
| ASTM Type III | ≥0.05 | <200 | Autoclave feed, glassware rinsing, feed water for higher grades |
| CLSI CLRW | ≥10 | <500 | Clinical chemistry analyzers, electrolytes, immunoassay, molecular diagnostics |
Choosing the wrong baseline grade here doesn’t produce a contained error. It propagates through your instrument selection, your method validation thresholds, and your monitoring protocols.
And correcting a grade mis-selection after installation typically means full system replacement. Not adjustment.
So get this right before you do anything else.
How Each Purification Technology Targets A Different Contaminant Class
This is where most procurement decisions fall apart.
No single purification technology produces Type I water on its own. Every stage in a multi-technology stack targets a specific contaminant class, and the sequence those stages run in determines whether your system actually meets spec at the point of dispense.
The Ionic Removal Stages You Can’t Skip
Reverse osmosis (RO) is the standard pre-treatment stage for Type I production. The membrane rejects dissolved ions, organics above 300 Daltons, particulates, and microorganisms at 90–99% ionic rejection efficiency. Neutral organic molecules below 100 Daltons pass through at significantly lower rejection rates.
So downstream stages for organic control aren’t optional. They’re structurally required.
Ion exchange and deionization address what RO leaves behind on the ionic side. Mixed-bed resin cartridges exchange cations and anions for H⁺ and OH⁻, driving resistivity toward 18.2 MΩ·cm. A single-pass mixed-bed polisher after RO is the standard configuration for Type I output.
Run direct tap water input without RO pre-treatment and you’ll foul your resin fast. Cartridge life drops from months to weeks.
UV Oxidation: How Your System Kills Organics And Microbes
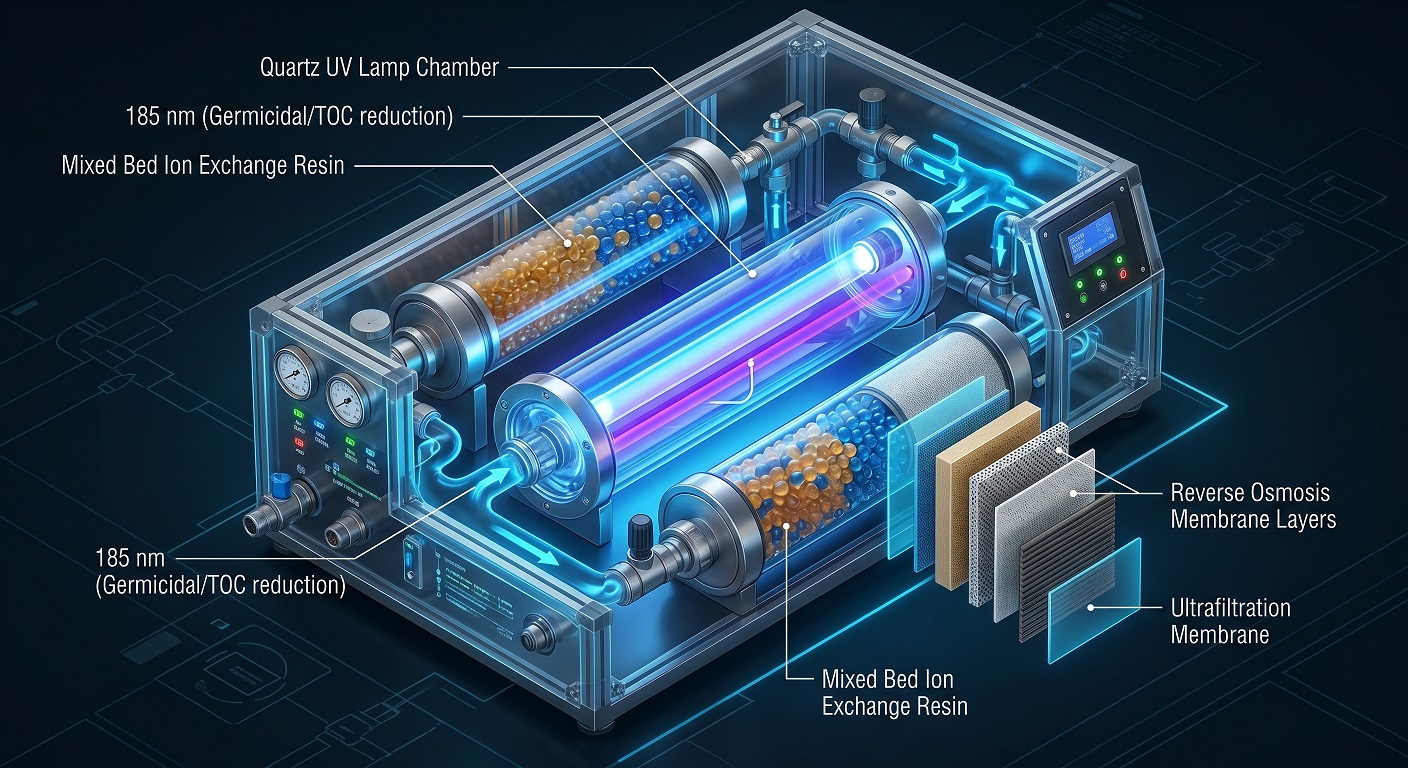
UV oxidation does 2x jobs in a Type I system. At 185 nm, it generates hydroxyl radicals that reduce TOC toward sub-5 ppb for sensitive chromatographic applications. At 254 nm, it inactivates microorganisms by disrupting microbial DNA.
But here’s the catch with the 185 nm process: oxidised organics become ionic. Those byproducts must be removed by a downstream mixed-bed polishing stage, not before it.
Ultrafiltration: The Only Stage That Stops Endotoxins

Ultrafiltration (UF) operates on a completely different principle. A 5–13 kDa hollow fiber membrane excludes endotoxins, nucleases, and pyrogens that ionic stages and UV leave behind. Endotoxins are bacterial cell-wall fragments that trigger immune responses in mammalian systems.
In solution, endotoxin aggregates reach up to 1,000 kDa and pass straight through standard 0.22 µm filters. UF at the point of use is required for molecular biology and cell culture workflows. The membrane doesn’t improve resistivity, but it removes contaminant classes that ionic purity measurements cannot detect at all.
How To Match Your Water Grade To Every Workflow Without Guessing
Here’s the rule that most labs ignore: the correct water grade for any workflow is determined by its most sensitive analytical endpoint, not the workflow’s general category.
A lab running HPLC, PCR, and buffer preparation needs 3x different grade answers. And none of the failure modes for a mismatch reliably announces itself.
The Silent Ways Under-Specifying Wrecks Your Results
HPLC and LC-MS require Type I water for mobile phase preparation. Organic contaminants accumulate on the column stationary phase during aqueous gradient runs and elute as peaks that are completely indistinguishable from your sample components.
In LC-MS, ionic contaminants cause sodium and potassium adducts under electrospray ionisation (ESI), reducing sensitivity and complicating spectral interpretation. Neither failure mode produces a definitive error signal without a clean water blank run for comparison.
PCR failures from water quality are even more silent. Calcium and iron compete with magnesium at the Taq polymerase active site, the enzyme driving your PCR amplification. The result is degraded Cq values and understated copy numbers.
That source often goes unidentified until a spike-in inhibition control finally confirms water as the cause.
ICP-MS operates at sub-parts-per-trillion detection limits. Any trace metal in the water used for standard preparation enters the calibration curve directly. Ionic contamination raises the blank reading and inflates reported concentrations across every result in that period.
The error is systematic and typically only surfaces when independent verification produces implausible values.
Sound like a lot to track? It gets worse when you add biological workflows.
The Grade Every Biological Workflow Actually Needs
Cell culture and mammalian assay workflows require Type I water with ultrafiltration at the point of use. Full stop.
Endotoxins survive autoclaving and pass through standard 0.22 µm filters, making sterilisation alone an insufficient control. In mammalian cell culture, endotoxin contamination activates TLR4 receptor signalling, the cell-surface pathway that detects bacterial endotoxins.
The results appear experimentally valid. But cannot be reproduced.
And you won’t be able to tell the difference between that and a genuine biological response under study.
Type II water covers buffer prep, media formulation, general chemistry, and clinical analyser feeds governed by CLRW specs. Autoclave feed and glassware rinsing are Type III territory.
Using Type I for either wastes consumable budget with zero analytical return. Map each workflow to its minimum acceptable grade before you look at a single vendor spec sheet. That step alone prevents both categories of procurement error.
The 3x Monitoring Parameters You Need To Track Independently
A water system validated at installation is not a water quality guarantee. Full stop.
Components degrade continuously. And the parameters that matter most for your workflows are not all visible through the same sensor. You need at least 3x independent measurement approaches, each targeting a contaminant class the others cannot detect.
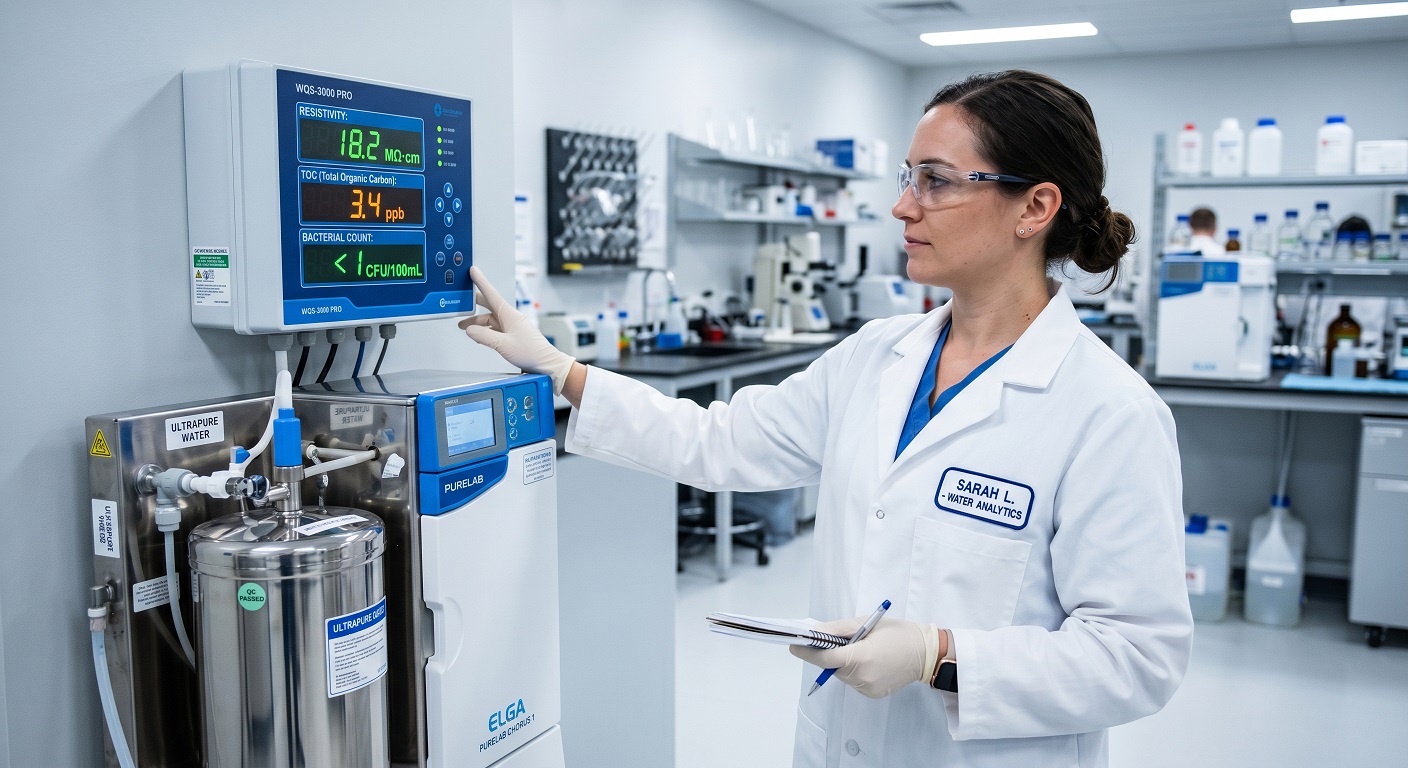
1. Resistivity: Your Baseline Ionic Purity Check
Resistivity monitoring is your baseline indicator for ionic purity. It runs inline continuously, and that’s exactly where it must stay. Offline measurement is not reliable for high-purity water. Atmospheric CO₂ dissolves into a collected sample within seconds and suppresses your resistivity reading substantially.
For Type I water, any sustained reading below 18.2 MΩ·cm signals resin exhaustion or a membrane breach. A gradual decline points to consumable exhaustion. A sudden drop signals an acute system failure.
But here’s what resistivity will never tell you:
A system reading 18.2 MΩ·cm can carry significant organic contamination, active biofilm, and endotoxins simultaneously. The number looks perfect. The water isn’t.
2. TOC: The Early Warning Signal Resistivity Can’t Give You
TOC monitoring uses inline UV oxidation followed by conductometric detection of the resulting ionic species. Your alert threshold for Type I water is 5–10 ppb.
3. Microbial Monitoring: The Parameter Neither Sensor Can Detect
Microbial monitoring is the third parameter, and it needs its own approach entirely. Resistivity and TOC sensors don’t detect bioburden, the total microbial load in your water.
Culture-based pour plate methods or online fluorescence sensors are required where bioburden is a critical workflow parameter. For CLRW, any bacterial count above 10 CFU/mL triggers a formal investigation.
How To Build A Maintenance Schedule That Actually Protects Your Data
A validated monitoring schedule for Type I water systems covers 4x time horizons.
Daily tasks: log inline resistivity, check fault indicators, inspect for flow anomalies. Weekly reviews: TOC trend data and visual inspection of tubing and dispensing nozzles for discoloration or early biofilm. Monthly tasks: sensor calibration verification, aseptic sampling for bacterial count, and cartridge service log review.
Annual tasks: UV lamp replacement on a fixed schedule regardless of visual status, and RO membrane chemical sanitisation to remove accumulated biofilm fouling.
And here’s a sustainability angle most labs don’t factor into their maintenance planning: RO systems generate reject water at 1:1 to 4:1 waste-to-product ratios, depending on membrane condition and feed water quality.
At a 4:1 ratio, producing 10 litres of pre-purified water consumes 50 litres of potable input. Replacing consumables before exhaustion keeps your RO membrane at peak efficiency, cutting reject water volume and the cartridge burden downstream.
How To Select The Right Laboratory Water Purification System Before You Talk To A Single Vendor
Most labs start system selection by comparing vendor offerings. That’s backwards.
Start with a systematic audit of every workflow in your lab. Map each to its minimum acceptable grade and the contaminant class that would compromise its results. Do this before you open a single brochure.
Capital Cost Is The Wrong Primary Variable. Here’s What To Use Instead.
Endotoxin and nuclease removal requirements drive technology stack decisions well beyond basic grade compliance. Any lab running mammalian cell culture or molecular biology needs ultrafiltration at the point of use. Identifying that requirement first narrows the field to systems that can actually deliver on your application, and eliminates wasted evaluation time.
A benchtop Type I system costs $4,690–$8,700 at purchase. That number will feel like the whole decision. It isn’t.
Cartridge, resin, membrane, and UV lamp replacements routinely exceed the unit’s purchase price over a 3–5 year operating horizon. Annual consumable costs add several hundred dollars before you even schedule lamp or membrane replacements.
Total cost of ownership across that horizon is the correct comparison framework. Not sticker price.
The Validation And Cost Factors Most Labs Forget To Budget For
Regulated labs need documented validation before a water system is released for use.
- Installation Qualification (IQ)
- Operational Qualification (OQ)
- Performance Qualification (PQ)
IQ verifies correct installation against design specs. OQ confirms all components function at defined limits. PQ provides ongoing documented evidence that the system consistently delivers on-grade water under routine conditions.
Vendors in regulated markets should supply IQ/OQ/PQ protocol documentation as part of the system package. Factor validation services into your total cost model from the outset. They typically add $1,500–$5,000 to your procurement budget.
Miss that line item and it hits you at the worst possible time.
Wrapping It Up
Water grade selection, purification technology matching, and ongoing monitoring aren’t 3x separate decisions. Each constrains the others. An error at any stage propagates forward without producing a clear signal, often well after contamination has already entered your workflow.
The labs that protect their data quality treat water as a managed analytical input, not an afterthought. They document the specs, match the technology, and verify the parameters on a schedule.
Which of the failure modes in this guide is most likely hiding in your current setup right now? Drop a comment below and let’s work through it.

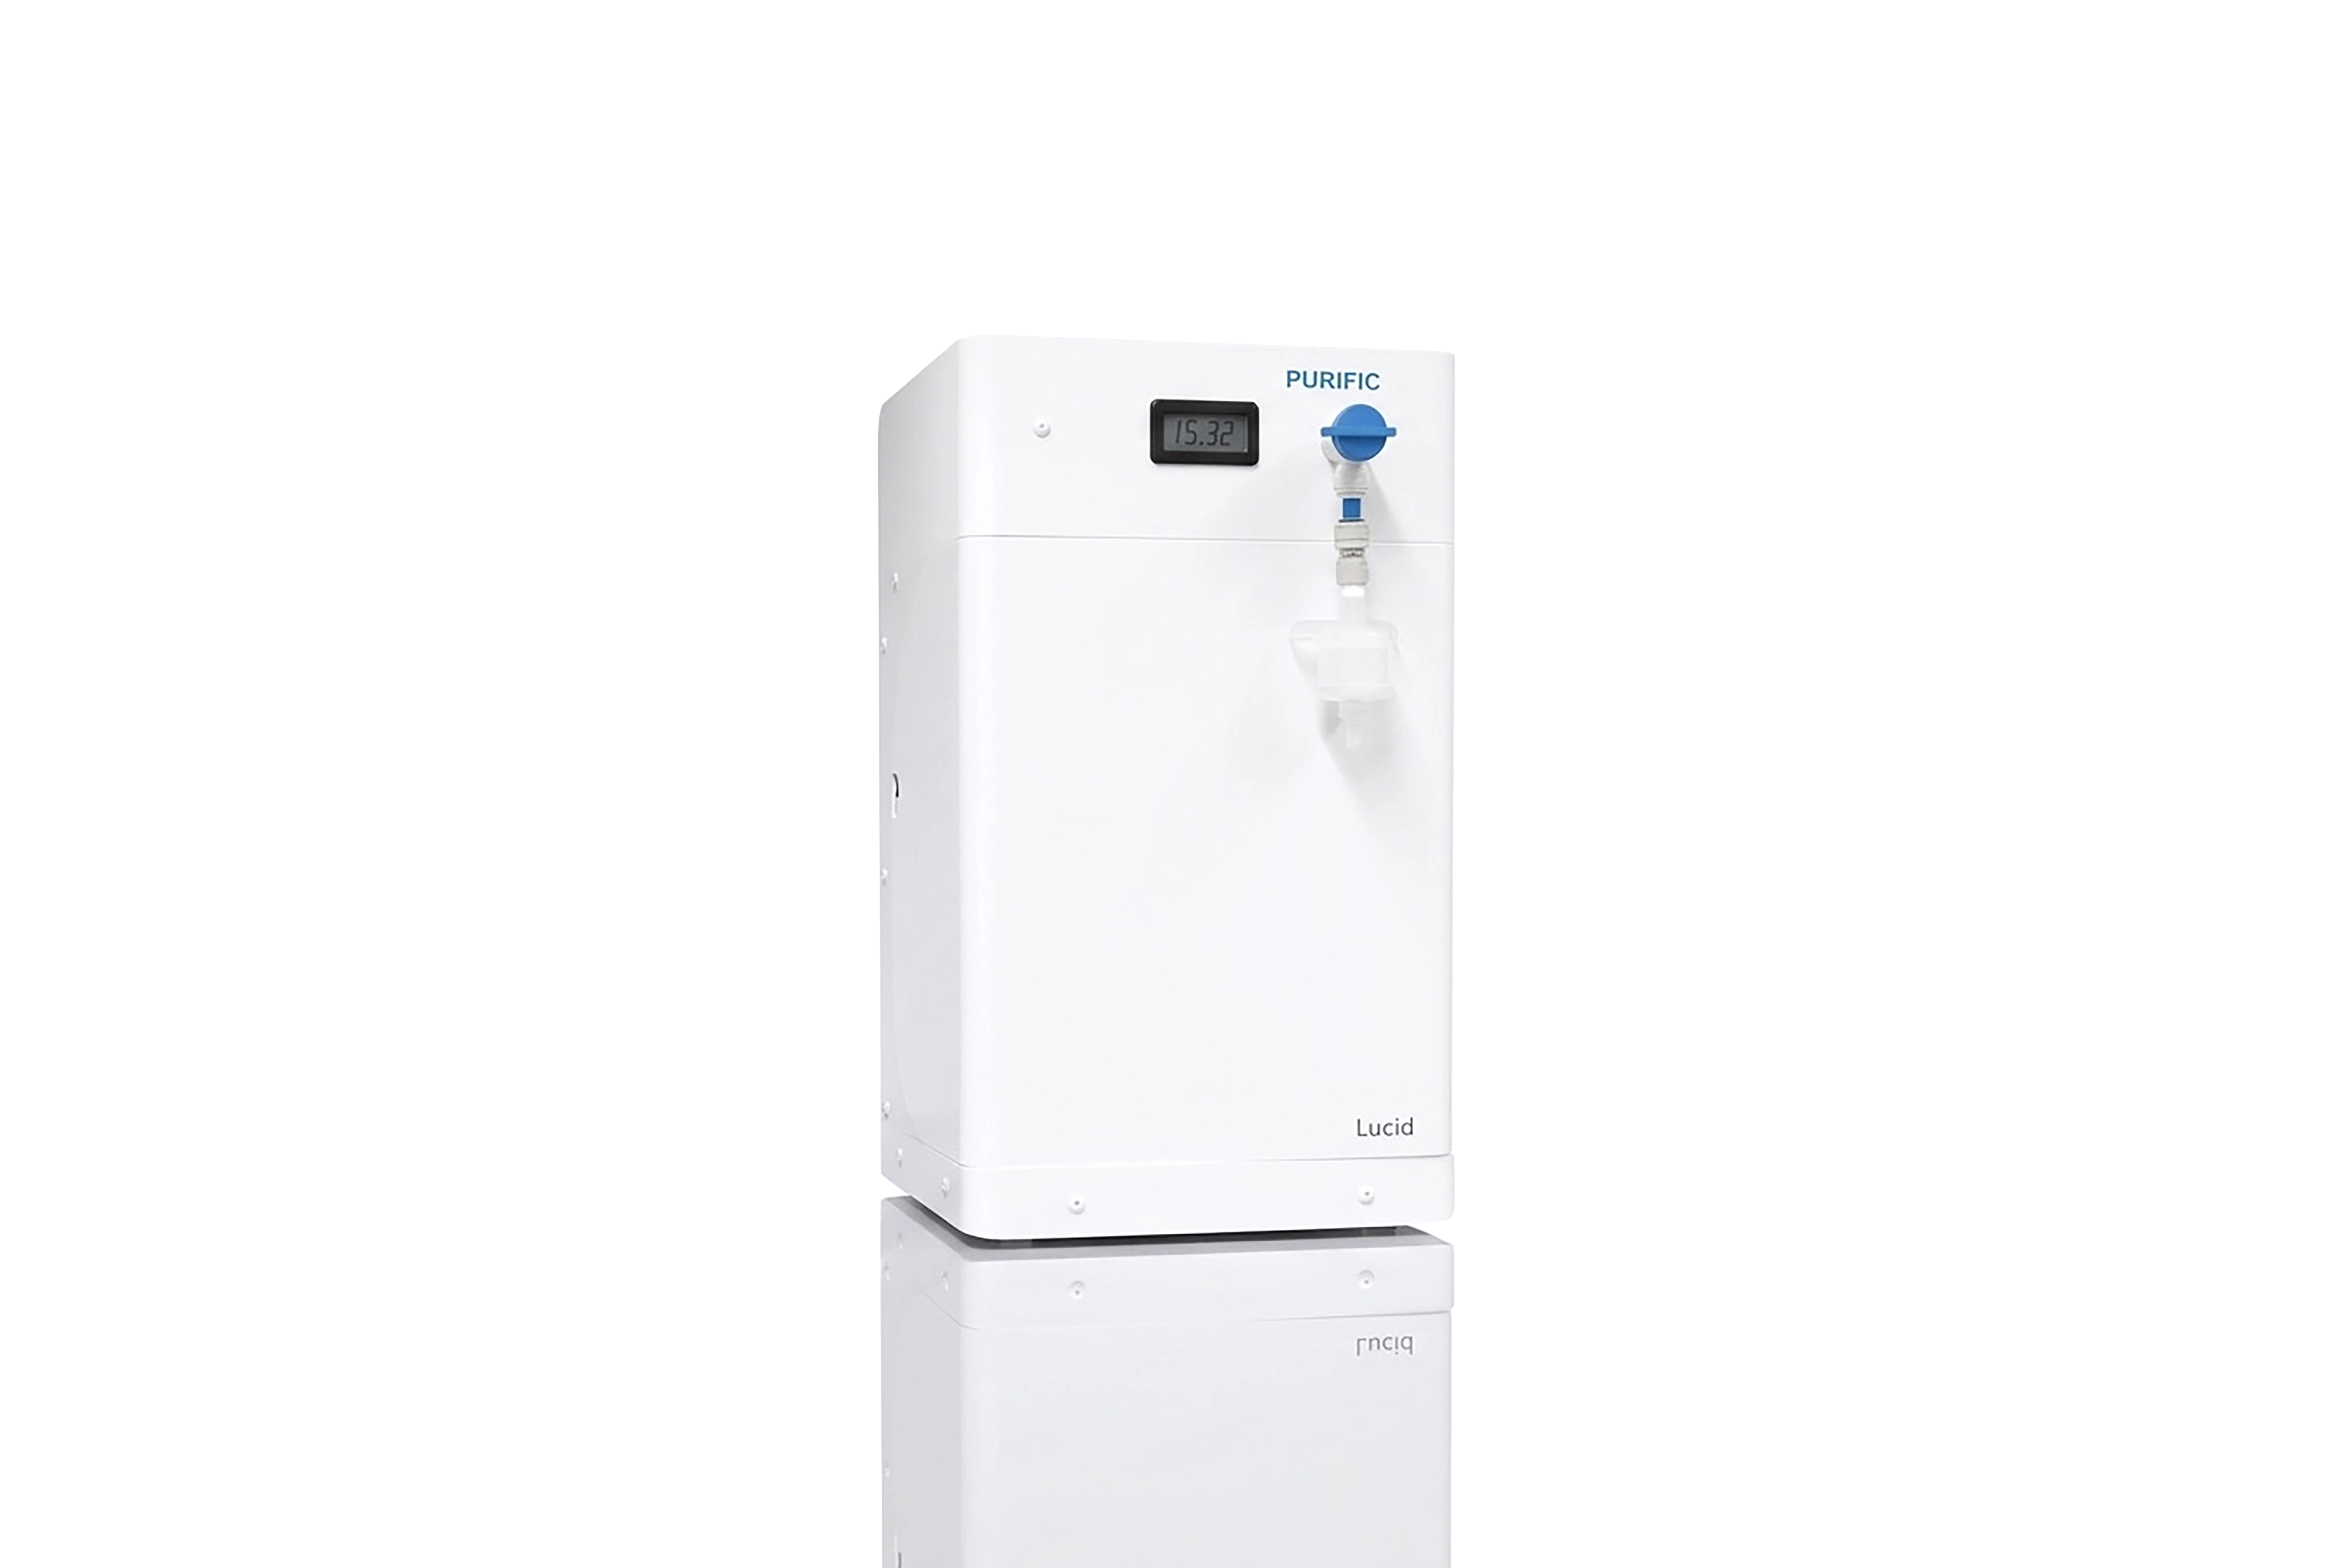
Purific Australia sells water purification systems, including some of the products and technologies discussed in this article. This content is written to inform, not to sell. Where a Purific product is a relevant solution, we say so plainly. Where it is not the right fit, we say that too.
All technical claims are based on published research, manufacturer data, or direct laboratory testing. If you have questions about a specific product recommendation or want independent verification of any data cited here, contact our technical team.