Improving reverse osmosis efficiency in a laboratory setting requires understanding your water-to-drain ratio, maintaining RO membranes on a data-driven schedule, configuring recirculation loops, and setting smart auto-shutoff valves to minimize reject water output.

These are not just sustainability goals; they are operational cost levers that the most competitive labs are already pulling. Get this right, and you reduce water bills, extend membrane life, and build a defensible sustainability record for regulators and funders.
Most lab managers think about RO efficiency only when something breaks. By then, the damage to your water budget and your membrane is already done. The number you are about to learn is the one your facility manager does not want to calculate.
The Mechanics of Water to Drain Ratio
Understanding your water-to-drain ratio is the first step toward improving your system’s performance. This ratio tells you exactly how much water your RO unit sends to the drain for every unit of purified permeate it delivers. It is the single most important number for quantifying both your environmental footprint and your operating cost.
Here is the physics: reverse osmosis works by forcing feed water through a semipermeable membrane under pressure. The membrane allows pure water molecules to pass through as permeate, but the dissolved salts, organics, and contaminants it rejects have to go somewhere. They exit the system as concentrate, or brine, continuously flushed away to prevent buildup on the membrane surface.
The Standard Ratio Range and What It Means for Labs
According to the U.S. Environmental Protection Agency’s WaterSense program, typical point-of-use RO systems operate at efficiencies between 10 and 20 percent, meaning they send roughly 4 to 9 gallons to the drain for every gallon of product water produced. EPA’s WaterSense label requires a maximum reject ratio of 2.3 gallons of drain water per gallon of treated water, a standard that most legacy lab systems do not meet.
Expressed as a recovery rate: if your system runs at 25% recovery, 75 liters out of every 100 liters of feed water are discharged as reject. For a laboratory producing 50 liters of purified water per day, that means discarding up to 150 liters of reject daily, or roughly 54,750 liters per year.
The ratio is affected by four primary variables:
- Feed water TDS (total dissolved solids): higher TDS forces lower recovery rates to protect the membrane from scaling
- Operating pressure: insufficient pressure reduces membrane flux and forces higher drain flow to compensate
- Membrane condition: fouled membranes require more water to flush the concentrate stream, raising the ratio significantly
- Restrictor and valve settings: incorrectly sized flow restrictors are one of the most common and easily corrected causes of excess drain flow in lab systems
To understand what reverse osmosis is doing inside your water treatment stack before you optimize it, Purific’s reverse osmosis in water treatment primer is a solid foundation.
Your ratio is the baseline. What moves it in the wrong direction, faster than anything else, is a membrane that has not been properly maintained. That is where most labs lose the most water without ever noticing.
Impact of RO Membrane Maintenance on Waste
Membrane fouling is the single biggest driver of wasted water in laboratory RO systems. When your membrane fouls, its permeability drops. The system compensates by increasing pressure and drain flow to maintain adequate permeate output. The result: your water-to-drain ratio climbs quietly, month by month, until you are wasting far more than your original spec ever intended.
According to peer-reviewed research published in PMC, fouling reduces a membrane’s lifespan and permeability while simultaneously increasing operating pressure and chemical cleaning frequency. This is not a minor efficiency drag. Organic fouling alone accounts for approximately 50% of fouling incidents documented in membrane autopsies across a range of water treatment systems.
Four Types of Fouling and Their Effect on Recovery Rate
Each fouling type attacks your membrane differently and requires a different maintenance response:
- Colloidal fouling: fine particulate matter accumulates on the membrane surface; sediment pre-filtration at 5 microns or finer is the first line of defense
- Biofouling: microorganism colonies form a biofilm on the membrane surface, reducing flux and requiring sanitization cycles with sodium bisulfite or hydrogen peroxide solutions
- Organic fouling: natural organic matter and humic substances adsorb onto the membrane, accounting for roughly half of all fouling events; pretreatment with activated carbon prefiltration is the primary countermeasure
- Scaling (inorganic fouling): calcium carbonate, silica, and sulfate precipitates form on the high-pressure side; anti-scalant dosing or water softening pretreatment are standard mitigations
Maintenance Intervals and Their Impact on the Drain Ratio
Failing to replace sediment and carbon pre-filters on schedule is the most common way lab teams accelerate membrane fouling without realizing it. A clogged pre-filter allows contaminants to reach the RO membrane that should have been captured upstream. The membrane loads faster, permeability drops sooner, and your reject stream grows to compensate.
Minimum maintenance schedule for laboratory RO systems:
- Sediment pre-filter (5 micron): replace every 6 months or when feed pressure drop exceeds 10 psi across the filter housing
- Activated carbon pre-filter: replace every 6-12 months; critical for removing chlorine, which destroys polyamide membrane material within hours of contact
- RO membrane: test water quality every quarter with a TDS meter; replace when rejection rate drops below 90%, or at maximum every 2-3 years
- Post-filters and polishing stages: replace annually per manufacturer specification
- Full system sanitization: minimum annually, or after any evidence of microbial contamination in the permeate
Head-to-Head: Reactive vs. Scheduled Membrane Maintenance
| Factor | Reactive (Replace on Failure) | Scheduled (Data-Driven) |
|---|---|---|
| Average drain ratio impact | Up to 2-3x baseline | Maintained at system spec |
| Membrane lifespan | Shortened significantly | Maximized |
| Pre-filter replacement cost | Higher (membranes also need early replacement) | Lower |
| Water wasted per year | High; growing undetected | Controlled and measured |
| Audit documentation | None | Full compliance record |
| Risk of permeate quality failure | High | Low |
If your lab uses both RO and deionized water in your purification train, the maintenance relationship between stages matters. Purific’s comparison of deionized versus distilled water for labs explains where each technology fits and how upstream RO performance directly affects downstream DI unit costs.
Membrane maintenance reduces waste by keeping your system running at its designed efficiency. But the bigger opportunity is how your system is configured in the first place. A well-maintained membrane in a poorly configured system is still a wasted membrane.
Adopting Sustainable Laboratory Practices
Sustainable laboratory water practices go beyond swapping out one piece of equipment for a more efficient model. They require configuring your entire RO system to maximize yield from the feed water you already pay for.
The starting point is understanding your actual versus potential recovery rate. Most lab RO systems ship with conservative default settings designed for a wide range of feed water conditions. Those defaults protect the membrane in high-TDS environments but leave water-saving potential on the table in lower-TDS municipal supply conditions.
System Configuration for Maximum Yield
Three configuration changes consistently move the efficiency needle in laboratory RO systems:
1. Flow restrictor sizing. The flow restrictor on the concentrate line controls how fast reject water exits the system. An undersized restrictor lets too much water flush to drain. An oversized restrictor allows scaling on the membrane. The correct restrictor size is calculated based on your feed water pressure and target recovery rate. For municipal feed water at 60-80 psi, a properly sized restrictor typically raises recovery from the default 15-25% range to 50-75%, cutting drain water output by more than half.
2. Permeate pump installation. A permeate pump uses the energy in the concentrate stream to boost product-side pressure, reducing the pressure differential across the membrane needed to maintain flow. This allows the system to achieve higher recovery without requiring higher feed pressure, directly reducing the volume of water needed to push each gallon of permeate through the membrane.
3. Automatic shut-off valve calibration. Improperly calibrated automatic shut-off valves allow water to continue trickling through the drain even when the storage tank is full. Verifying that your shut-off valve closes cleanly at the specified tank pressure is a zero-cost fix that can eliminate a significant source of continuous drain flow.
Key system configuration checklist:
- Verify flow restrictor size against feed pressure and target recovery specification
- Test and confirm automatic shut-off valve function under full tank pressure
- Check for and repair any saddle valve restrictions on the drain line that reduce drain flow beyond design specification
- Confirm feed water pressure is within the 40-80 psi operating range for most lab RO membranes; below 40 psi, both recovery rate and rejection performance drop sharply
Modern RO systems from leading manufacturers can approach a 1:1 product-to-waste ratio in optimal conditions, a dramatic improvement over the 5:1 or worse ratios common in legacy installations. The configuration, not the membrane alone, determines where on that spectrum your system operates.
But configuration and hardware are only half the picture. The operational habits that happen around your RO system every day either protect that efficiency or erode it. Here is where most facilities give up ground they never knew they had.
Practical Tips for Wastewater Reduction
Even a perfectly configured and well-maintained RO system still produces some concentrate. The question is not how to eliminate reject water entirely; it is how to ensure every liter of it is accounted for and, wherever possible, redirected to productive use instead of the drain.
This is the operational layer of lab water sustainability, and it is the one most facilities never implement because it requires intention, not just hardware.
Wastewater reduction strategies for laboratories:
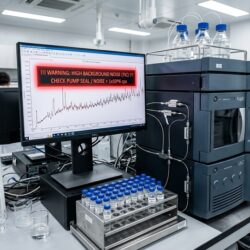
- TDS monitoring and early intervention. Install an inline TDS meter on both the feed and permeate lines. Log the readings weekly. A rising permeate TDS is your earliest warning sign of membrane degradation, which also means your reject ratio is climbing. Catching this before the membrane fails outright saves both water and the cost of emergency replacement.
- Concentrate recirculation for low-TDS feed water. If your feed water TDS is below 500 mg/L, a portion of the concentrate stream can be recirculated back to the feed inlet, effectively raising the system’s overall recovery rate. This requires monitoring to ensure TDS in the recirculated stream does not rise to levels that trigger scaling; a conductivity meter on the recirculation line provides the necessary control point.
- Staged use of reject water. RO reject water is not contaminated; it simply has a higher TDS than your feed supply. For most municipal water inputs, reject water TDS in the 500-1,500 mg/L range is entirely suitable for floor cleaning, equipment rinse-downs, or autoclave cooling water. Plumbing a secondary use line from your concentrate outlet is a practical, low-cost diversion.
- Demand-matched production scheduling. RO systems that run continuously during low-demand periods waste water filling storage they do not need. Configuring production schedules to match actual lab operating hours reduces both water waste and membrane wear.
Smart Valve Settings and Recirculation Loops
The concentrate recirculation loop is one of the most underutilized tools in laboratory water conservation. When implemented correctly, it can raise a system’s effective recovery rate from 25% to 50% or higher without any change to the membrane itself.
The critical control parameter is the recirculation ratio: what fraction of the concentrate stream is returned to feed versus discharged to drain. This is controlled by a manual or automated valve on the concentrate line. Setting it too high increases feed TDS, raises scaling risk, and can reduce rejection performance. Setting it too low leaves recovery improvement on the table.
A practical starting point is a 30-40% recirculation ratio for municipal feed water below 300 mg/L TDS. Monitor permeate TDS and concentrate conductivity weekly after implementing recirculation. If permeate TDS rises more than 10% above baseline, reduce the recirculation ratio by 5% increments until stability is restored.
For labs where water quality is as critical as water quantity, it is worth connecting the dots between your contamination control program and your RO system performance. Purific’s lab contamination audit checklist addresses how facility hygiene affects every purification system in your stack.
The EPA’s WaterSense program sets the efficiency benchmark at 2.3 gallons of reject per gallon of product. The ASSE 1086 standard targets a 1.5:1 ratio, which represents 40% efficiency. These are not aspirational figures for facilities in 2026. They are achievable thresholds for any lab willing to configure, maintain, and monitor their RO system with the same rigor they apply to their research.
Your system is either moving toward those benchmarks or drifting away from them. Measurement is the only way to know which direction you are heading.