
Selecting the wrong grade from the available types of lab water does not produce an obvious failure. Results look like sample error, instrument drift, or reagent variability.
The water source comes last on the investigation list.
The consequence is data you cannot defend. Grade misselection shows up as ghost peaks in HPLC, suppressed PCR amplification, and elevated ICP-MS blanks.
Inflammatory artifacts in cell culture follow the same pattern. Each failure mode ties to a specific contamination class, and every class has a grade threshold where it stops being controlled.
- How each ASTM, ISO, and CLSI framework defines lab water grades and where they diverge
- Which grade threshold applies to your specific application
- How each purification method maps to a contaminant class and residual profile
- The monitoring criteria required to verify your specified grade holds at the point of use, not just at commissioning
Why Wrong Water Grade Corrupts Your Data
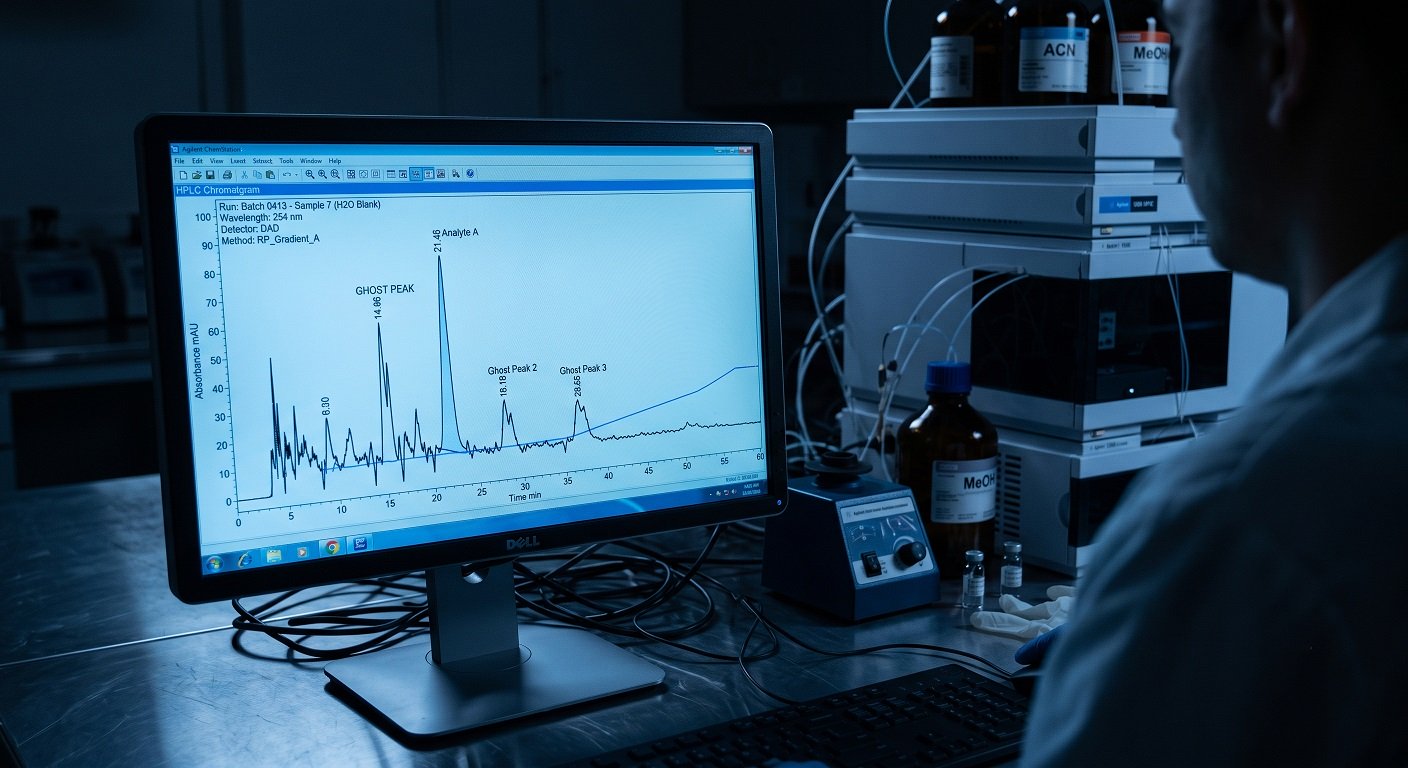
Wrong water grade does not announce itself. In HPLC and LC-MS, organic impurities accumulate on the stationary phase and desorb during gradient elution. This produces ghost peaks at retention times that can coincide with real analyte signals.
Why Each Application Fails Differently
Studies attribute 60 to 70 percent of unexplained LC-MS ghost peaks to water contamination. Dissolved organics also suppress ionization, raising detection limits by a factor of 2 to 10.
ICP-MS operates at ppt detection limits, which makes reagent water a primary contamination vector. Trace metals appear as analyte signals, inflate blank readings, and push results above specification before a single sample is run.
PCR workflows face a different failure class. Metal ions including calcium, copper, and iron inhibit thermostable polymerases at concentrations that survive lower purification grades. Nucleases in inadequately purified water degrade template material before amplification begins.
Endotoxins from Gram-negative bacteria trigger pro-inflammatory cytokine release in mammalian cell culture. Bacteria at approximately 4,000 CFU/mL produce endotoxin concentrations near 8 EU/mL, measurably affecting cell growth, recombinant protein yield, and cloning efficiency.
The Grade Gap Behind Silent Failures
None of these failures are obvious. Wrong water grades produce results indistinguishable from sample error or instrument drift, so the water source is investigated last.
CLSI CLRW permits TOC up to 500 ppb. The practical threshold for reliable qPCR sits at or below 10 ppb, a 50-fold gap between grades that appear adjacent in naming.
Types of Water Used Labs
The types of laboratory water defined across ASTM D1193, ISO 3696, and CLSI GP40 do not map cleanly onto each other. Each standard uses different terminology, sets different numeric thresholds, and governs a different regulatory context.
Specifying correctly means knowing which standard applies to your lab and where the grades diverge in ways that affect your workflows.
Type I: Ultrapure Water
Type I water is the highest ASTM purity grade. It requires resistivity greater than 18 MΩ·cm at 25°C, TOC below 50 ppb, and bacterial counts below 10 CFU/mL.
Type I is the required input for HPLC, GC, ICP-MS, real-time PCR, DNA sequencing, and genetic screening. Grade A adds endotoxin limits for mass spectrometry and cell-based applications. In those workflows, biological contamination is as consequential as ionic purity.
Type II: General Laboratory Grade Water
Type II water is defined by resistivity greater than 1 MΩ·cm. It suits buffer preparation, pH standard dilution, clinical chemistry analyzers, and microbiological culture media.
Production combines reverse osmosis with ion exchange or electrodeionization. It also serves as feedwater to Type I polishing systems. For a detailed breakdown of how these two grades compare across applications, see Type I vs Type II lab water.
Type III: General Purpose and Feedwater
Type III water is a general-purpose grade used for glassware washing, humidifier supply, and equipment cleaning. It serves as cost-effective feedwater for Type I and Type II systems, not as a direct analytical grade.
Lab RO systems at this stage remove 90 to 99 percent of dissolved ions from the municipal supply.
Type IV: Pre-Treated Feedwater
Type IV water is the lowest ASTM grade, equivalent to pre-treated or municipally supplied water. It is used exclusively as starting feedwater for higher purification stages and is never applied directly in analytical work.
ISO 3696 and CLSI CLRW
ISO 3696 defines three grades, with Grade 1 mapping broadly to ultrapure applications. Grade 1 specifies maximum conductivity of 0.1 µS/cm and silica below 0.01 mg/L.
ASTM Type I targets resistivity greater than 18 MΩ·cm (approximately 0.056 µS/cm), a tighter ceiling than ISO Grade 1.
ISO 3696 includes no endotoxin specifications. CLSI GP40 defines Clinical Laboratory Reagent Water. Specifications include resistivity above 10 MΩ·cm, TOC below 500 ppb, bacteria below 10 CFU/mL, and 0.22 µm filtration.
College of American Pathologists (CAP)-accredited laboratories must follow this standard. The 2006 revision replaced Type I/II/III tiering with fit-for-purpose language, shifting grade selection responsibility to the lab and instrument manufacturer.
That gap is consequential for molecular biology. CLRW permits TOC up to 500 ppb while practical qPCR thresholds sit at or below 10 ppb.
For trace element work, CLSI itself notes resistivity must reach 18.2 MΩ·cm, above the CLRW minimum of 10 MΩ·cm.
Lab Water by Purification Method
Supplier datasheets and equipment specifications describe water by how it was produced, not by the ASTM grade it meets. Each method targets a different contaminant class and leaves a different residual profile.
That profile is the basis for building a specification that holds at the point of use.
Distilled Water
Distillation removes most non-volatile tap water contaminants through evaporation and condensation. It cannot remove volatile impurities including carbon dioxide, ammonia, and some organic compounds that co-distill with steam.
Conductivity between 0.1 and 0.5 µS/cm places distilled water below ASTM Type II, making it unsuitable for sensitive analytical applications without further treatment.
As a production method, distillation is energy-intensive and slow. It has largely been replaced in modern laboratory systems by RO pre-treatment combined with downstream polishing stages that achieve greater purity with lower operating cost.
Reverse Osmosis Water
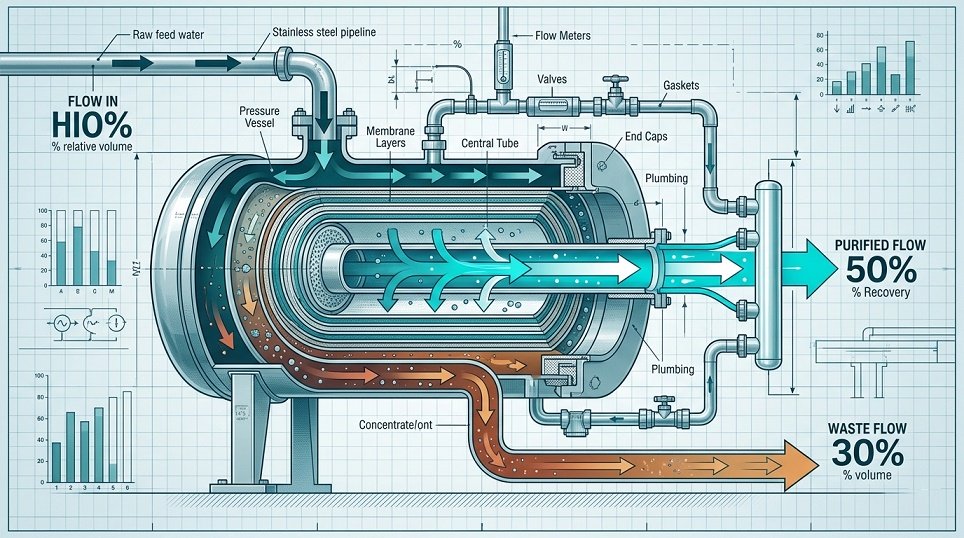
Reverse osmosis forces feed water through a semi-permeable membrane under pressure exceeding the osmotic pressure of the feed solution. It removes dissolved salts, viruses, bacteria, colloids, endotoxins, and most organics at 90 to 99 percent efficiency.
RO does not produce a finished analytical grade on its own. It functions as pre-treated feedwater for Type I polishing systems.
The concentrate stream carries rejected contaminants to drain at ratios of 1:1 to 4:1. Feed water consumption of 2 to 5 liters per liter of product is the primary sustainability variable in system design.
Membrane condition, feed water chemistry, and operating pressure all affect permeate quality. A declining RO recovery rate is typically the first indicator of membrane fouling or scaling.
Deionised Water
Deionisation passes water through mixed-bed cation and anion exchange resin columns. Cation resin replaces metal ions with H+ while anion resin replaces anions with OH-.
The two combine to form water, driving resistivity toward the 18.2 MΩ·cm theoretical maximum. Achieving 18.2 MΩ·cm by deionisation alone confirms ionic removal but says nothing about organic, endotoxin, or biological contamination.
The method does not remove organics, endotoxins, or biological contaminants without additional stages. Dissolved silica passes through ion exchange resin unchanged, making it a specific concern for silica analysis workflows.
Resin exhaustion is the primary cause of post-commissioning resistivity drift. Track it against manufacturer-specified throughput limits, not on a fixed time interval alone.
Ultrapure Water
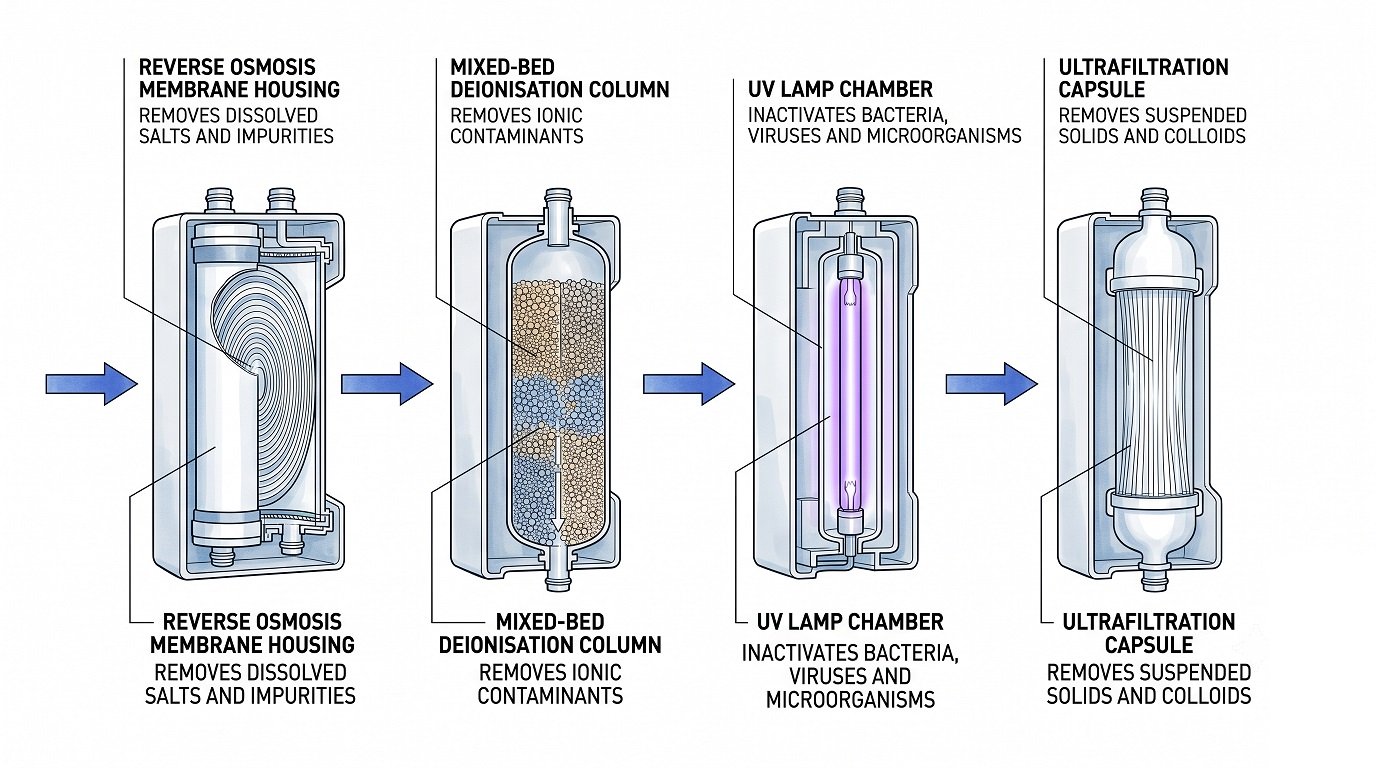
Ultrapure water is the finished product of a multi-stage stack: RO pre-treatment, deionisation, UV oxidation, and ultrafiltration. The 254 nm UV wavelength inactivates microorganisms by penetrating bacterial cell walls without chemical addition.
At 185 nm, hydroxyl radicals form and oxidize residual organics into ionic byproducts that downstream polishing resin removes.
UV lamp intensity declines continuously from first use. A lamp still illuminating may no longer deliver effective TOC reduction or microbial inactivation after approximately 9,000 hours.
Ultrafiltration removes endotoxins and nucleases that survive earlier stages, including endotoxin aggregates that reach up to 1,000 kDa in aqueous solution. The finished product achieves resistivity of 18.2 MΩ·cm, TOC below 10 ppb, and bacterial counts below 10 CFU/mL.
This is the ASTM Type I equivalent.
Verifying Water Quality at the Point of Use
A passing resistivity reading at commissioning does not confirm water quality six months later at the dispense point. Each monitoring method covers a non-overlapping contamination class.
Running fewer than all three leaves a blind spot that no reading frequency can compensate for.
Inline Resistivity Sensors
Inline resistivity sensors measure ionic breakthrough continuously at the point of dispense. A sustained drop from 18.2 MΩ·cm signals resin exhaustion or a membrane breach requiring immediate investigation.
Resistivity sensors cannot detect organic or biological contamination regardless of how frequently they are read.
Inline TOC Analyzers
Inline TOC analyzers measure dissolved organic contamination via UV oxidation and conductometric detection. Alert thresholds for Type I systems are typically set at 5 to 10 ppb.
TOC excursions driven by UV lamp decline produce no change in resistivity. That makes TOC monitoring a non-redundant requirement, not an optional complement to ionic measurement.
Culture-Based Microbial Counts
Culture-based microbial counting is the only reliable method for detecting biofilm development before it reaches the dispense point. A resistivity reading of 18.2 MΩ·cm and low TOC do not rule out bacterial contamination in the distribution loop.
Scheduled culture sampling must run alongside continuous electronic monitoring, not as a periodic substitute for it.
How to Select and Sustain Your Water Grade
Defaulting to Type I across the facility avoids under-specification but significantly increases operating cost, RO water consumption, and cartridge turnover. The correct approach is minimum required grade per application class, verified at the point of use.
Concurrent monitoring sustains that specification rather than periodic spot checks.
Workflow-Indexed Grade Assignment
Glassware rinsing, autoclave feed, and humidifier supply do not justify Type I costs. Type III covers those applications at a fraction of the operating expense.
Buffer preparation, clinical chemistry analyzers, and microbiological culture media fall under Type II. Clinical analyzer feed should be confirmed with the instrument manufacturer before finalizing the specification.
Labs governed by CLSI for clinical chemistry and by ASTM or GLP for molecular biology or trace element work effectively operate under two standards simultaneously. In those cases, CLRW covers the clinical tier. A separate Type I supply is required for workflows exceeding those TOC and resistivity thresholds.
HPLC mobile phase, ICP-MS standard preparation, qPCR reagents, and mammalian cell culture all require Type I. TOC at the point of use must sit at or below 10 ppb.
Labs producing large volumes of Type II centrally can install point-of-use polishing cartridges at workstations requiring Type I. This reduces full-facility Type I production and its associated RO consumption.
Post-Commissioning Drift and How to Catch It
Three mechanisms drive in-service quality degradation, and each is caught by a different monitoring method. Resin cartridge exhaustion produces resistivity drift, detected by inline sensors.
UV lamp intensity decline produces TOC excursions that resistivity monitoring will not catch.
Biofilm accumulation in distribution lines is detected only by scheduled culture-based sampling. Rising TOC is the earliest reliable indicator that a polishing stage is failing, appearing before resistivity drops.
Labs running TOC monitoring have an earlier warning of system degradation than labs running resistivity alone.
Sustainability and Validation
RO systems consume 2 to 5 liters of potable feed water per liter of product. Facilities under water use mandates should evaluate RO recovery optimization or point-of-use polisher configurations that reduce full-system RO demand.
RO concentrate can also be redirected to non-analytical uses including equipment cooling and facility cleaning, reducing net potable consumption.
Installation Qualification, Operational Qualification, and Performance Qualification (IQ OQ PQ) protocols establish the performance baseline at commissioning. Resistivity logs, TOC data, microbial counts, and cartridge replacement records constitute the audit evidence base under GLP, GMP, and CAP frameworks.
GLP, GMP, and CAP frameworks all require this documentation for regulatory inspection. A passing PQ at commissioning does not cover in-service drift.
Audit readiness requires documented ongoing performance, not just the commissioning record.
Treat Grade Selection as a Specification Commitment
Water grade selection is not a procurement decision you make once at system commissioning. It is a specification commitment requiring application-indexed grade assignment, point-of-use verification, and concurrent monitoring across all three contamination classes.
A grade that passes at installation does not always hold at the dispense point six months later. That gap is where data integrity risk lives.
Resistivity alone will not close that gap.
If your workflows or system configuration need to be matched to the right grade, consult a laboratory water systems specialist. A specialist can map your application requirements to grade thresholds and identify monitoring gaps before they affect your data.

Purific Australia sells water purification systems, including some of the products and technologies discussed in this article. This content is written to inform, not to sell. Where a Purific product is a relevant solution, we say so plainly. Where it is not the right fit, we say that too.
All technical claims are based on published research, manufacturer data, or direct laboratory testing. If you have questions about a specific product recommendation or want independent verification of any data cited here, contact our technical team.