
When analytical results are unreliable and the instrument checks out, the problem frequently traces back to the water. Type 1 water is defined by a resistivity ceiling (a measure of how few dissolved ions remain in the water) of 18.2 MΩ·cm at 25°C, but that number describes only ionic purity.
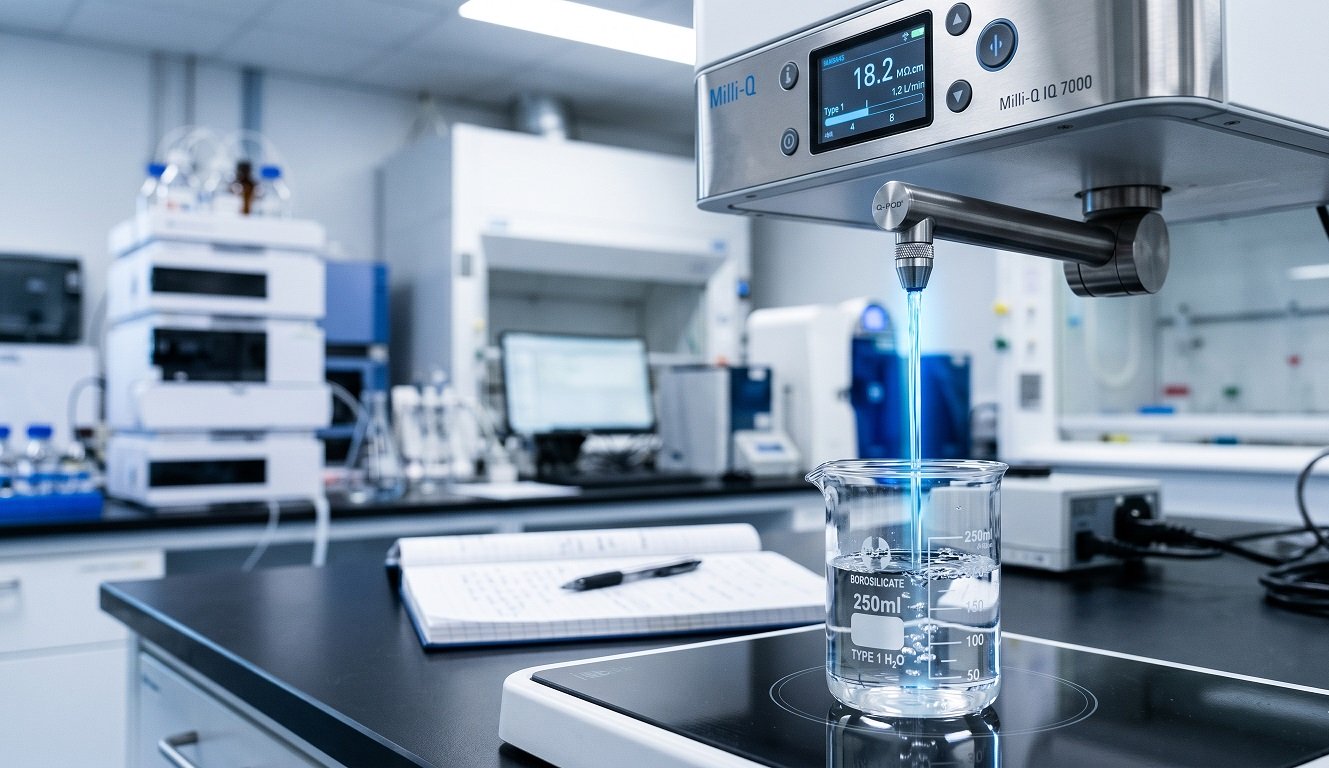
A system can read 18.2 MΩ·cm while still carrying organic contaminants, endotoxins (bacterial cell wall fragments), and particles that resistivity monitoring cannot detect.
Each purity threshold in the type 1 specification exists because a specific contaminant causes a specific failure in a specific application. Understanding which threshold matters for your workflow, and why, is what makes the difference between a specification that protects your results and one that only appears to.
What Makes Type 1 Water Different From Other Purity Grades
Three organizations publish specifications for laboratory reagent water, and they do not fully agree. ASTM International, the International Organization for Standardization, and the Clinical and Laboratory Standards Institute each define purity grades using overlapping but distinct parameters.
For most laboratory professionals, ASTM D1193-06 is the operative standard: it defines four water types (I through IV), with Type 1 representing the highest purity, and adds three sub-classifications (A, B, and C) that govern microbial and endotoxin control within each type.
ISO 3696:1987 defines three grades, with Grade 1 as the purest. Its resistivity requirement for Grade 1 sits at 10 MΩ·cm, well below the 18.2 MΩ·cm ceiling set by ASTM Type 1.
The CLSI moved away from type designations after 2006, preferring that water be fit for purpose. Its Clinical Laboratory Reagent Water standard requires resistivity above 10 MΩ·cm and permits total organic carbon (TOC) up to 500 ppb. That figure is roughly 100 times more permissive than the 5 ppb threshold required for critical analytical work under ASTM Type 1.
The divergence matters most when specifying water for analytical chemistry. High-performance liquid chromatography (HPLC), inductively coupled plasma mass spectrometry (ICP-MS), and liquid chromatography-mass spectrometry (LC-MS) workflows require ionic and organic purity that ISO Grade 1 and CLSI CLRW do not guarantee.
A lab operating under an ISO or CLSI framework for clinical diagnostics may be producing water appropriate for its intended application, while the same water would degrade results in a high-sensitivity analytical instrument.
Why the 18.2 MΩ·cm Ceiling Is a Physical Limit
The 18.2 MΩ·cm ceiling is not a specification number someone chose. Pure water’s self-ionization constant (Kw ≈ 10⁻¹⁴ at 25°C) fixes this ceiling, producing H⁺ and OH⁻ at 10⁻⁷ mol/L.
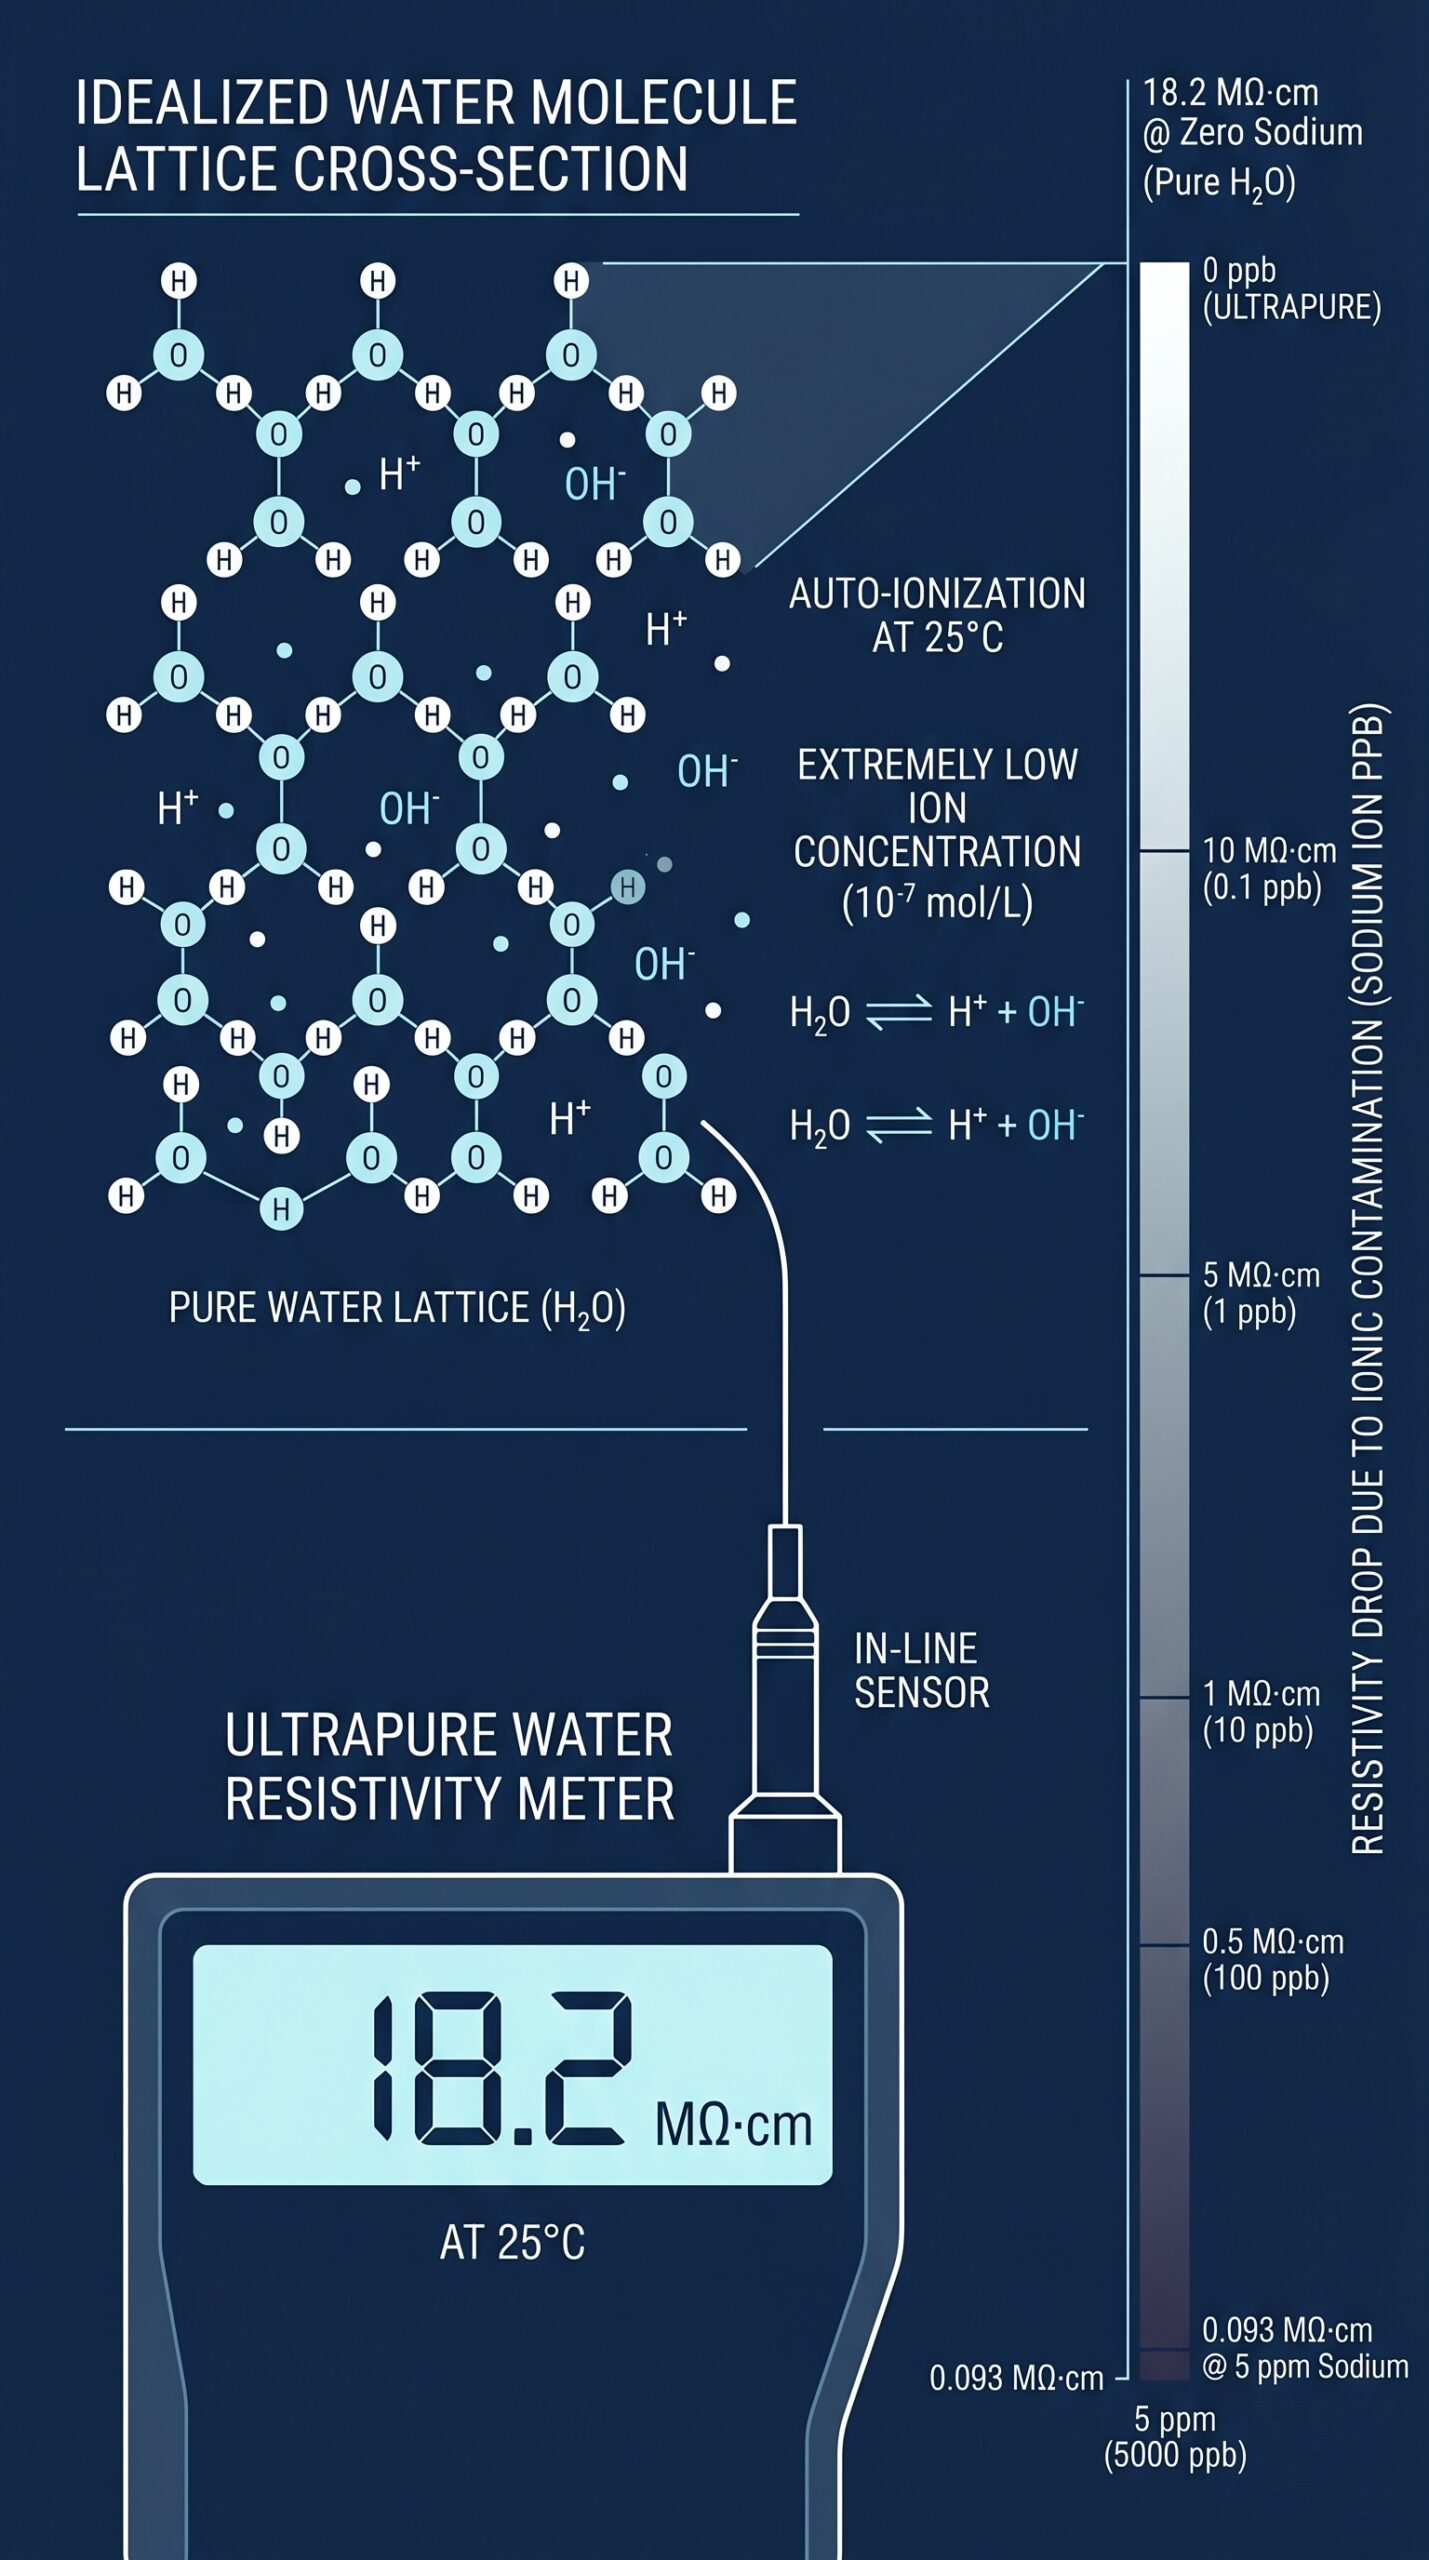
Any dissolved ionic species adds to the water’s conductance and suppresses resistivity below this value. Sodium, chloride, sulfate, carbonate: each contributes charge carriers that the resistivity meter detects as a drop from the theoretical maximum.
At 1 ppb of sodium ions, resistivity falls to approximately 17.6 MΩ·cm; at 5 ppm sodium, it collapses to 0.093 MΩ·cm. In ICP-MS sample preparation, sodium at sub-ppm levels causes ionization suppression and generates polyatomic interferences in the plasma.
The ⁴⁰Ar¹⁶O⁺ ion interferes with the ⁵⁶Fe signal, for instance, pushing detection limits from sub-ppb into the ppb range.
What Resistivity Cannot See
Resistivity, however, measures only ionic species. Organic molecules at neutral pH carry no charge, contribute nothing to conductivity, and pass through resistivity monitoring completely undetected.
This is why the ASTM Type 1 specification includes a separate TOC limit. For standard Type 1 applications, that ceiling sits below 10 ppb; for critical analytical work, the practical threshold is 5 ppb or lower.
Organic contamination at these concentrations produces distinct failure modes depending on the application. In HPLC and ultra-high-performance liquid chromatography (UHPLC), water used as mobile phase or for sample preparation must have TOC at or below 5 ppb to maintain a stable baseline.
Organic residues at higher concentrations accumulate on the column stationary phase during aqueous loading and co-elute during gradient runs as ghost peaks: spurious signals that cannot be distinguished from low-concentration analytes.
Polymerase chain reaction (PCR) and molecular biology workflows are sensitive in a different way. Trace organics at ppb concentrations can inhibit Taq polymerase, the enzyme that drives DNA amplification, reducing amplification efficiency and generating nonspecific bands or complete amplification failure.
Because these failures are indistinguishable from template problems or setup errors, the water is often the last variable investigated rather than the first.
Where Type 2 and Type 3 Fall Short
Type 2 and Type 3 water occupy the grades below, and the specification gaps are not subtle. Type 2 requires resistivity at or above 1 MΩ·cm and allows TOC below 50 ppb, an 18-fold gap in resistivity and a 10-fold gap in organic permissiveness relative to Type 1.
How the Gaps Translate to Analytical Failures
Using Type 2 water as mobile phase in HPLC introduces organic residues that accumulate on the column and elute as ghost peaks during gradient runs. For ICP-MS sample preparation, residual ionic species in Type 2 water suppress plasma ionization efficiency and raise detection limits from sub-ppb to the ppb range.
Type 3 water sits further down still, with a resistivity floor of just 0.05 MΩ·cm and TOC allowed up to 200 ppb. It is appropriate for glassware rinsing, filling autoclaves, and as feed water to Type 1 or Type 2 systems, not as a reagent in analytical workflows.
Using Type 3 water in place of Type 1 in a sensitive assay is not a marginal quality compromise. It is a category error that guarantees result contamination.
What the Full Type 1 Specification Actually Covers
The full ASTM Type 1 specification covers parameters beyond resistivity and TOC. Endotoxin limits are set below 0.03 endotoxin units per mL (EU/mL), particle contamination must remain below one particle per mL above 0.2 µm, silica must stay below 3 ppb, and bacteria below 10 colony-forming units per mL (CFU/mL).
These parameters address failure modes that resistivity monitoring cannot detect and that become operative depending on the specific application. Which of them applies to your work is the question the rest of this article addresses.
How Purification Systems Produce Type 1 Water
No single purification technology reaches type 1 purity on its own. Reverse osmosis removes the bulk of dissolved solids but leaves residual ions, organics, and microorganisms.
Standalone deionization polishes ionic content but does nothing for non-ionic organics, endotoxins, or particles. Reaching 18.2 MΩ·cm with verified TOC below 10 ppb requires a sequence of stages, each targeting a contaminant class the previous stage cannot address.
How Each Stage Targets a Different Contaminant
The standard production sequence runs: pretreatment, reverse osmosis, ion exchange or electrodeionization, UV photo-oxidation at 185 nm, ultrafiltration, and a terminal 0.2 µm filter at the point of use. Each stage has a defined removal target, a mechanism that achieves it, and a verification method that confirms it is still working.
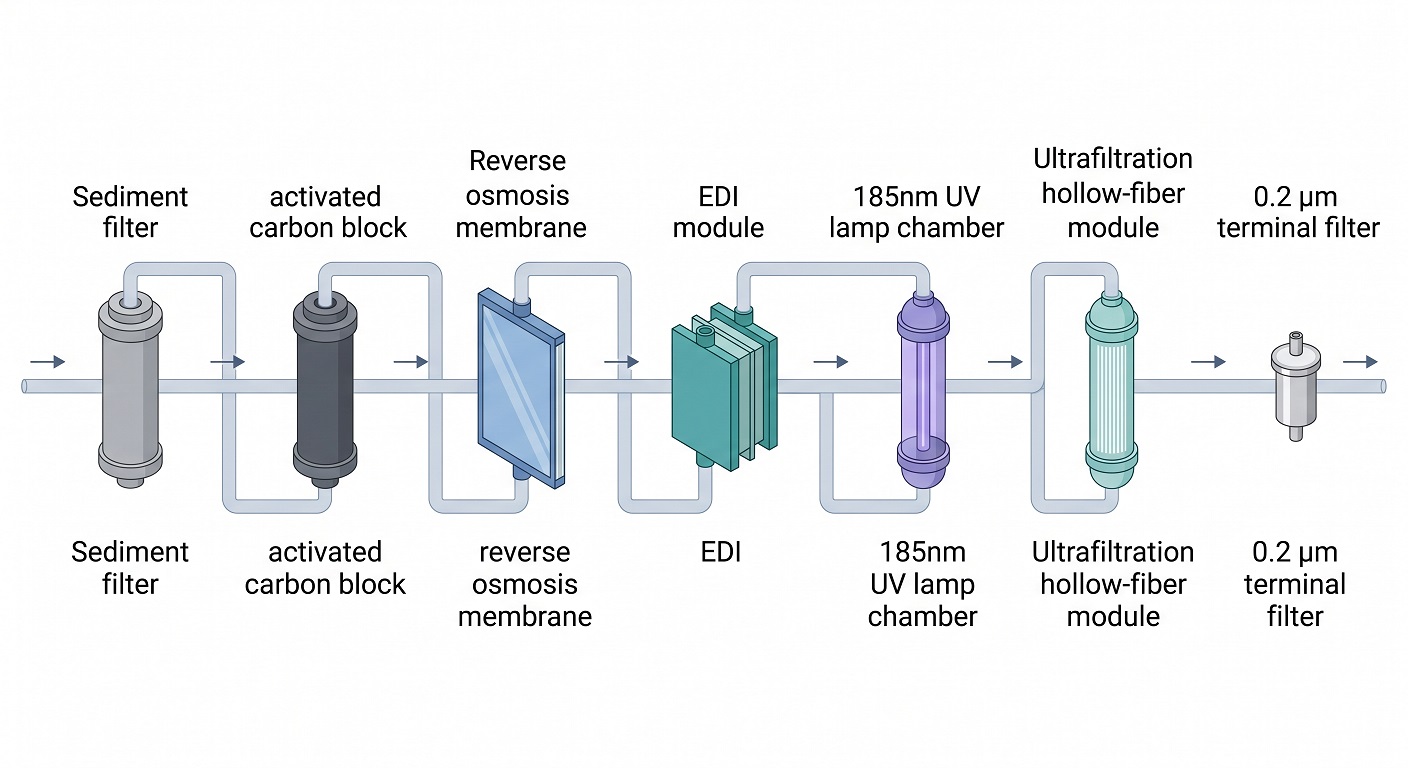
When one stage degrades silently, the output can appear compliant on the primary display while carrying contaminants the display cannot detect.
Pretreatment protects everything downstream. Each step targets a different vulnerability in the feed water stream.
- Sediment filtration removes particles above 5 µm that would foul membranes.
- Activated carbon removes chlorine and chloramines that would otherwise degrade RO membranes and oxidize ion-exchange resins.
- Water softening reduces hardness ions that cause membrane scaling.
None of these steps contribute directly to type 1 purity specifications, but their failure shortens membrane and resin life and allows upstream contamination to propagate through the system.
Reverse osmosis forces feed water under pressure through a semi-permeable membrane, removing 95 to 99 percent of dissolved salts, most organics with a molecular weight above 150 g/mol, and the majority of microorganisms. This removes the bulk contamination that would exhaust downstream polishing stages prematurely.
Total dissolved solids drop from roughly 500 ppm in tap water to between 5 and 25 ppm in the RO permeate. That output still falls well short of type 1 specification on every parameter.
Ion Exchange, EDI, and the Exhaustion Risk
Ion exchange or electrodeionization (EDI) handles the ionic polishing that RO cannot complete. In a conventional mixed-bed system, cation and anion exchange resins remove remaining inorganic ions by substituting them with hydrogen and hydroxyl ions, which combine to form water.
The result, when the resin is fresh, can reach 18.2 MΩ·cm.
As resins approach depletion, they release weakly ionized species including phosphates, silicates, and nitrates back into the product stream. Resistivity may remain near-specification during this phase because those species contribute little to conductivity.
The output is already contaminated with compounds that downstream applications cannot tolerate.
EDI addresses the exhaustion problem by eliminating the batch cycle entirely. It uses ion-exchange resins, ion-selective membranes, and a DC electrical field. Ions migrate through the membranes into a concentrate stream, while electrochemical water splitting regenerates resin capacity continuously.
No acid or caustic chemicals are needed. EDI consistently achieves resistivity above 15 MΩ·cm and can reach 18.2 MΩ·cm with a downstream mixed-bed polish.
It also excels at removing weakly ionized species such as silica and boron, which the electrical field converts to more easily removed ionic forms within the module.
UV Photo-Oxidation and Why Wavelength Matters
Even a system producing 18.2 MΩ·cm water at the ion exchange stage carries organic contamination that resistivity cannot detect. UV photo-oxidation at 185 nm is the stage that addresses this.
At 185 nm, photons cause water molecules to undergo homolysis, generating hydroxyl radicals (OH•) with a quantum yield of 0.33.
These radicals are non-selective oxidants that react with dissolved organic molecules and break them down to carbon dioxide and water. TOC reductions to below 1 to 2 ppb are achievable.
Breakdown products are removed by a post-UV ion-exchange cartridge, which also restores any resistivity lost to CO₂ dissolution.
The distinction between 185 nm and 254 nm UV matters here. Standard 254 nm lamps disrupt bacterial DNA replication effectively but do not produce sufficient hydroxyl radicals from water photolysis to mineralize dissolved organics.
A system relying on 254 nm UV alone for TOC control is not controlling TOC. Both wavelengths are emitted by low-pressure mercury lamps, but only those with high-purity quartz envelopes transmit the 185 nm output required for organic oxidation.
Ultrafiltration and the Final Particle Barrier
Ultrafiltration removes what UV photo-oxidation cannot: colloids, macromolecules, endotoxins, and biological particles too large to be addressed by ionic or oxidative processes. Membranes with a molecular weight cutoff of around 10,000 daltons intercept endotoxin aggregates, which form structures up to 1,000 kDa, along with any residual bacteria and viruses.
For biological-grade type 1 water used in cell culture or molecular biology, ultrafiltration is not optional. It is the stage that removes nucleases and proteases (enzymes that degrade DNA/RNA and proteins respectively) that would otherwise compromise sensitive biological workflows.
Terminal filtration at 0.2 µm is the final barrier before the water reaches the dispense point. Its purpose is not to compensate for degraded upstream stages.
It removes microorganisms and particles that enter the distribution loop downstream of the polishing stages, from tubing, fittings, and dispenser components. If terminal filtration is absent or compromised, microbial contamination and particulate introduction can occur after all purification is complete, rendering the upstream process moot for applications where biological cleanliness matters.
Confirming the System Is Still Performing
On-line resistivity monitoring provides continuous, real-time confirmation of ionic purity at the point of measurement. A valid reading requires temperature compensation to 25°C, because water conductivity changes by approximately 2 percent per degree Celsius.
Without this correction, a reading at 20°C will appear higher, producing a false indication of purity.
ASTM D1125 specifies the normalization protocol. Resistivity monitoring does not indicate TOC, endotoxin, particle load, or microbial content. Complete type 1 verification requires on-line TOC analysis per ASTM D5173 alongside resistivity.
Biological applications additionally require periodic limulus amebocyte lysate (LAL) testing and microbial plate counts. Ion exchange resin cartridges should be replaced at least annually for sensitive applications, regardless of what the resistivity display reads.
A system can hold resistivity above 18.0 MΩ·cm for twelve to eighteen months while aging resins silently leach non-ionic organics into the product water. Resistivity detects ionic exhaustion only. The TOC consequence of overdue resin replacement is invisible to the primary instrument display until the contamination appears in the analytical results.
Type 1 Water Specifications and the Failures They Prevent
Key takeaways
- Resistivity confirms ionic purity only; TOC, endotoxin, particulates, and silica each require separate monitoring.
- The operative parameters depend on your application: analytical workflows prioritise resistivity and TOC; biological workflows add endotoxin and microbial control.
- Each parameter maps to a specific failure mode (ghost peaks, signal suppression, cell toxicity, or yield defects), not to a general quality level.
The type 1 water specification is not a single number. It is a set of contaminant ceilings, each mapped to a failure mode in a specific application. Resistivity, TOC, endotoxin, microbial count, particulates, and silica each address a different interference category.
Understanding which parameters are operative for your workflow is what turns a specification sheet into an actionable quality standard. Which parameters matter depends entirely on what your workflows demand.
Ionic Contamination and What It Does to Your Results
Ionic contamination is the parameter most laboratories monitor first, and for good reason. Resistivity at or above 18.2 MΩ·cm confirms that ionic species are below the detection threshold, with temperature compensation to 25°C per ASTM D1293 required for a valid reading.
At 1 ppb of sodium ions, resistivity drops to approximately 17.6 MΩ·cm. That concentration is sufficient to generate sodium adduct peaks in LC-MS spectra, appearing as [M+Na]⁺ ions alongside the expected [M+H]⁺ peaks and complicating spectral interpretation.
In ICP-MS, the consequences extend further. Sodium and chloride at sub-ppm levels cause charge-transfer reactions and ionization suppression in the plasma, generating polyatomic interferences that overlap with analyte masses.
The ⁴⁰Ar¹⁶O⁺ interference on ⁵⁶Fe raises the effective detection limit for iron from the sub-ppb range into the ppb range, with no indication from the resistivity display that the water is responsible. ICP-MS standards require 18.2 MΩ·cm water with TOC below 5 ppb, collected fresh into pre-cleaned perfluoroalkoxy polymer (PFA) containers at the point of use.
How TOC Failures Show Up in Analytical Results
TOC addresses the contamination that resistivity cannot see. For standard type 1 applications, the ceiling is below 10 ppb; for critical analytical workflows, the threshold is 5 ppb or lower.
On-line TOC analysis per ASTM D5173 is the verification method. Analyzers oxidize dissolved organics to CO₂ and quantify the result by conductometry or infrared detection, with alarming set at the application-specific threshold.
In HPLC and UHPLC, organic contamination above 5 ppb in the mobile phase water accumulates on the column stationary phase during aqueous loading. During gradient elution, those residues co-elute as ghost peaks: signals indistinguishable from low-concentration analytes in the sample.
Baseline noise rises to a level where integration becomes unreliable, and the problem persists across multiple runs as the column becomes progressively more contaminated. The water is rarely the first variable checked when ghost peaks appear, which is why the contamination often continues longer than it should.
PCR workflows encounter organic interference differently. TOC above 5 ppb can inhibit Taq polymerase activity, reducing amplification efficiency and producing nonspecific bands or complete amplification failure.
These results are indistinguishable from template degradation, incorrect primer design, or thermocycler errors. A laboratory troubleshooting a failed PCR run may work through every other variable before testing the water, particularly if the resistivity reading appears normal throughout.
When Endotoxin and Microbial Limits Become Operative
Endotoxin and microbial limits are not relevant to every type 1 application. For purely analytical workflows such as HPLC, ICP-MS, and gas chromatography (GC), ionic and organic purity are the operative failure-mode parameters.
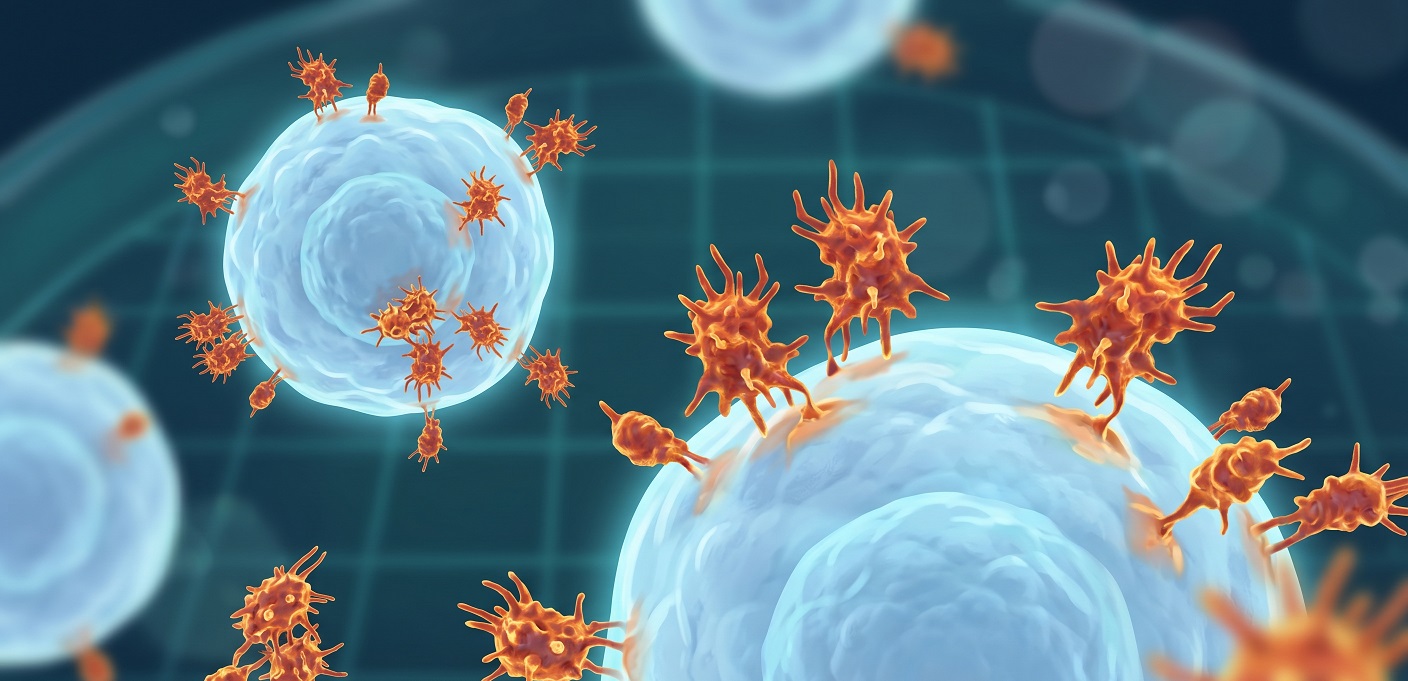
Endotoxin becomes a primary concern the moment water enters a biological workflow. Cell culture, IVF, in vivo preparations, and molecular biology reagents all require endotoxin control that analytical work does not.
The ASTM D1193 endotoxin limit for type 1 water is below 0.03 EU/mL. Endotoxins are lipopolysaccharide (LPS) molecules from the outer membranes of Gram-negative bacteria. They are thermostable: standard autoclave sterilization does not remove them.
Mammalian cell culture is particularly vulnerable: endotoxin directly activates immune pathways in the cells themselves. Human mesenchymal stem cell work shows effects on cell behavior at concentrations as low as 0.1 ng/mL. IVF culture media present similar concerns, with endotoxin above 1 ng/mL associated with reduced pregnancy rates; the LAL assay measures these levels down to 0.001 EU/mL using the kinetic turbidimetric format.
Particulates and Silica: The Contaminants That Resist Standard Removal
Particulate contamination is controlled at fewer than one particle per mL above 0.2 µm in the type 1 specification. For most laboratory applications, this is sufficient.
In semiconductor wafer fabrication, consequences scale sharply with process node. At a 65 nm node, a 0.2 µm particle is three times the minimum feature size (a yield-killing defect at that scale).
Silica occupies a distinct position in the type 1 specification because it resists standard RO removal. Dissolved silica exists as silicic acid at neutral pH, a form that passes through RO membranes in its monomeric state.
Colloidal silica, the polymerized form, is partially rejected by RO but is not detected by standard molybdate colorimetric testing. Reaching the type 1 silica ceiling of below 3 ppb requires EDI or mixed-bed ion exchange polishing after the RO stage.
The analytical consequence of silica contamination is most acute in inductively coupled plasma optical emission spectrometry (ICP-OES) and atomic absorption spectroscopy. Silicon has emission lines at 251.6 nm and 288.1 nm in ICP-OES, and dissolved silica above 3 ppb raises the background at these wavelengths.
When silicon itself is the target analyte, silica in the preparation water contributes directly to the analytical blank. This raises the detection limit and introduces systematic positive bias into every result.
Matching Type 1 Water to Your Application and System Design
Knowing the type 1 specification is not the same as knowing which part of it applies to your work. Two laboratories can both require type 1 water and arrive at entirely different system configurations, handling requirements, and ASTM sub-classifications.
Four components drive the decision: application sensitivity, governing standard, production method, and point-of-use handling constraint. Working through each in order produces an actionable specification rather than a general purity target.
Matching Your Application to the Right Standard
Application sensitivity determines which failure modes are operative. Analytical chemistry workflows (ICP-MS, HPLC, LC-MS) are primarily sensitive to ionic and organic contamination, with endotoxin and nuclease control as secondary concerns.
Biological workflows such as mammalian cell culture, IVF, PCR, and next-generation sequencing require ionic and organic purity and add endotoxin and nuclease removal as primary requirements. Semiconductor and precision rinsing applications additionally require particulate control alongside ionic and organic purity.
Governing standard selection follows from application sensitivity. ASTM D1193-06 applies to most laboratory workflows and provides the most complete specification framework, including the sub-classification layer for microbial and endotoxin control.
ISO 3696 applies when operating under international regulatory frameworks, but its Grade 1 resistivity floor of 10 MΩ·cm makes it insufficient for HPLC or ICP-MS. CLSI CLRW applies primarily to clinical diagnostic work; its TOC limit of 500 ppb is inadequate for any workflow requiring organic purity at the 5 ppb level.
Same Resistivity Floor, Different System Requirements
ICP-MS and mammalian cell culture illustrate how the same resistivity floor produces entirely different downstream requirements. Both applications require 18.2 MΩ·cm water.
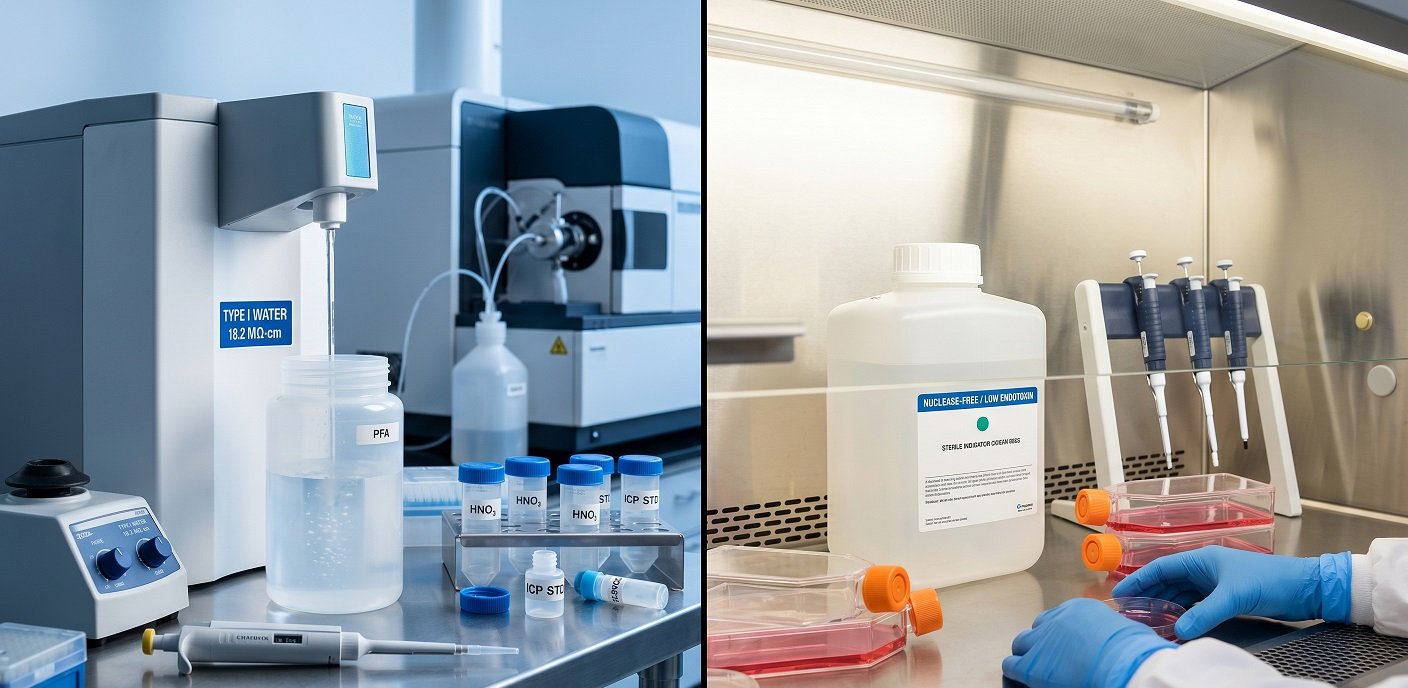
For ICP-MS, the operative parameters beyond resistivity are TOC below 5 ppb and trace metal exclusion. The architecture is RO plus EDI or mixed-bed, 185 nm UV photo-oxidation, and a 0.2 µm terminal filter, with no ultrafiltration stage required.
Endotoxin is not a concern for ICP-MS. Water must be collected immediately from the dispenser into pre-cleaned PFA containers and used without delay.
Mammalian cell culture at the same resistivity floor adds three requirements that ICP-MS does not have. Endotoxin must remain below 0.03 EU/mL, nucleases and proteases must be absent, and the ASTM sub-classification A designation applies.
The system architecture adds a depyrogenation-grade ultrafiltration cartridge with a 10,000 to 13,000 dalton (Da) molecular weight cutoff after the standard type 1 stages. Dedicated low-endotoxin, nuclease-free tubing and collection containers are required throughout the workflow.
Sharing a dispensing point between an ICP-MS station and a cell culture station creates cross-contamination risk in both directions.
Why Handling Determines Final Water Quality
Point-of-use handling is where type 1 water quality is most commonly lost after production. For analytical applications, the critical constraint is time.
Type 1 water absorbs carbon dioxide from air on contact, forming carbonic acid that dissociates to hydrogen and bicarbonate ions. Resistivity falls from 18 MΩ·cm toward approximately 1 MΩ·cm over roughly 48 hours in an open container.
The practical implication is immediate use from the dispenser into a pre-rinsed inert vessel, with no intermediate storage in standard labware.
Standard polypropylene and glass containers both contaminate type 1 water within minutes of contact. Polypropylene leaches trace metals and organic plasticizers; glass leaches boron and silica.
For ICP-MS sample preparation, PFA is the required container material. For cell culture, certified low-endotoxin containers with nuclease-free certification are required. In both cases, the container itself is part of the specification, not an afterthought.
Choosing a Sub-Classification and Sizing Your System
The ASTM D1193 sub-classification decision controls microbial and endotoxin requirements, with the applicable tier depending on your workflow category.
| Sub-classification | Applicable Workflows |
|---|---|
| A | Mammalian cell culture, IVF, in vivo preparations, and molecular biology workflows sensitive to nucleases: most stringent limits. |
| B | Most analytical applications requiring high sensitivity without biological-grade endotoxin control. |
| C | General laboratory work requiring high ionic and organic purity but not ultra-low microbial levels. |
System architecture involves a choice between point-of-use polishing from a centralized type 2 feed and a dedicated type 1 production system. Point-of-use polishing is lower in capital cost and consumable cost per litre: the type 2 system handles bulk purification and compact polishing cartridges deliver type 1 quality at each station.
The trade-off is cartridge capacity. A polishing cartridge sized for average demand may deliver near-spec water during peak usage periods if it approaches its limit before replacement.
Sizing polishing systems at 150 to 200 percent of expected peak daily demand provides the margin needed to avoid quality slippage under load. Dedicated type 1 production suits volumes above 10 litres per day, poor feed water, or multi-point centralized distribution.
Two labs sharing a type 2 feed can still run dedicated point-of-use polishing units with different cartridge configurations at each station. Both can draw from the same feed without cross-contaminating their respective workflows, provided the dispensing points remain separate.
Align Your Specification to Your Application, Standard, and System
Type 1 water selection is not resolved by confirming a resistivity number. Resolution comes from aligning three inputs: what your application tolerates, which standard applies, and what your system reliably delivers. Those three inputs produce a specification specific enough to protect your results.
The failure modes covered in this article are not theoretical. They appear in real results: suppressed signals, ghost peaks, failed amplifications, contaminated cultures.
Most are preventable once the relevant parameters are identified and monitored. Start with the application, confirm the standard, then match the system to both.
Leave a Reply
You must be logged in to post a comment.